
What’s the difference between Calls and Puts? That’s the question we’re going to answer in today’s lesson.
When I first started trading over 20 years ago, Calls and Puts were extremely confusing to me and so I actually printed out something similar to the guide below and I kept it next to my computer so I could keep them straight.

While it might seem confusing as a new trader, I promise it will become second nature after you start trading for a little while. Just remember, every option strategy is made up of a combination of buying and selling Calls and Puts. You may have heard different options trading strategies like Iron Condors, Butterflies, Calendar Spreads, Strangles, Straddles, strategies that you may not be familiar with, just keep in mind, they are all a combination of buying and selling Calls and Puts.
Guide Explained
Let’s take a minute to explain the guide above.
Calls
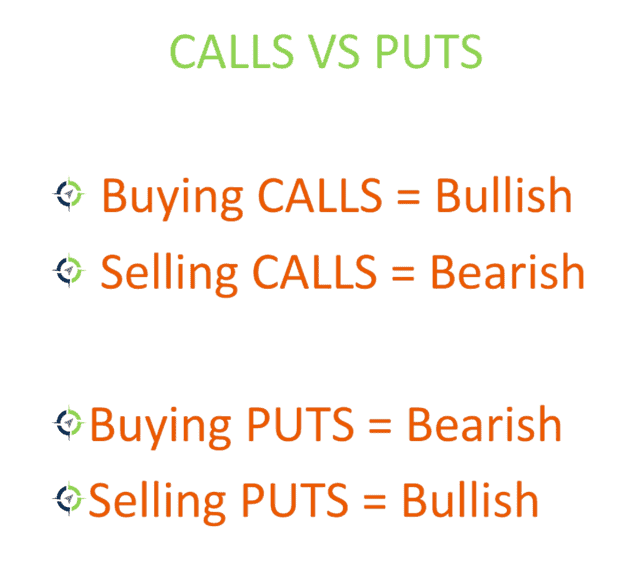
When you buy a Call, that’s bullish, meaning you want the stock to go up. If you’re selling Calls, that’s bearish, meaning you want the stock to go down.
Puts
If you’re buying Puts that’s bearish, meaning you want the stock to go down, and if you’re selling Puts that is bullish, meaning you want the stock to go higher.
Platform Examples
Now let’s jump over to the thinkorswim platform to go over an example.
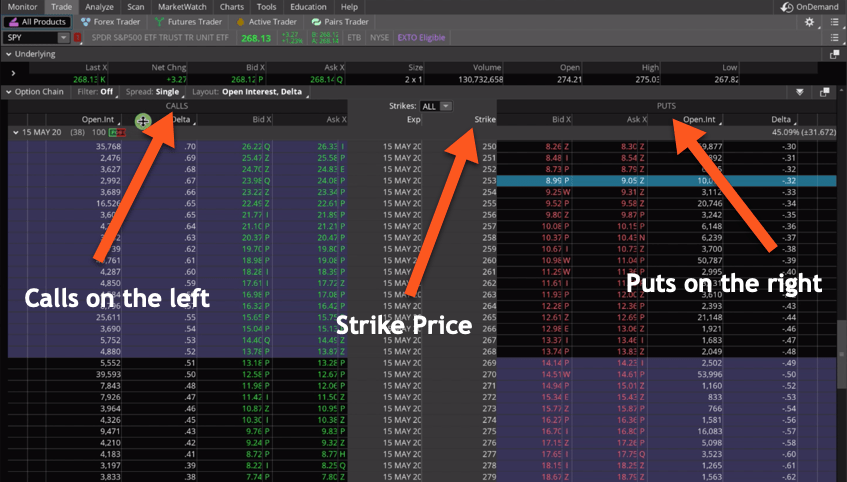
For this example, we’ll be utilizing SPY, which is the S&P 500 ETF. If we bring up the options chain, most trading platforms are set up the same way, where you have your Calls on the left hand column and your Puts on the right. In the column down the middle, that’s what we refer to as the strike price of the options.

Buying a Call
Let’s get started with a couple examples of Calls. We’ll go over an example of buying a Call and Selling a Call.
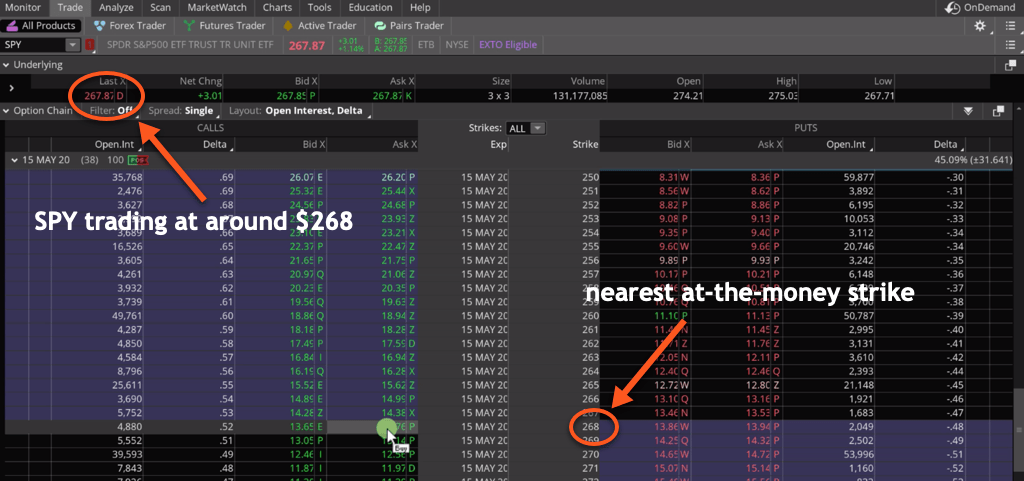
There are a lot of different options that we can choose from as far as the different strike prices. For this example, we’re going to choose the strike price that represents the closest at-the-money options. You can see up in the top right corner that SPY is trading for around $268, so we’re going to select the 268 strike price.

This is the what we call the bid and the ask columns. As you can see, when I hover over the ask, a little box pops up as “Buy”. If I hover over the bid, the box pops up as “Sell”.
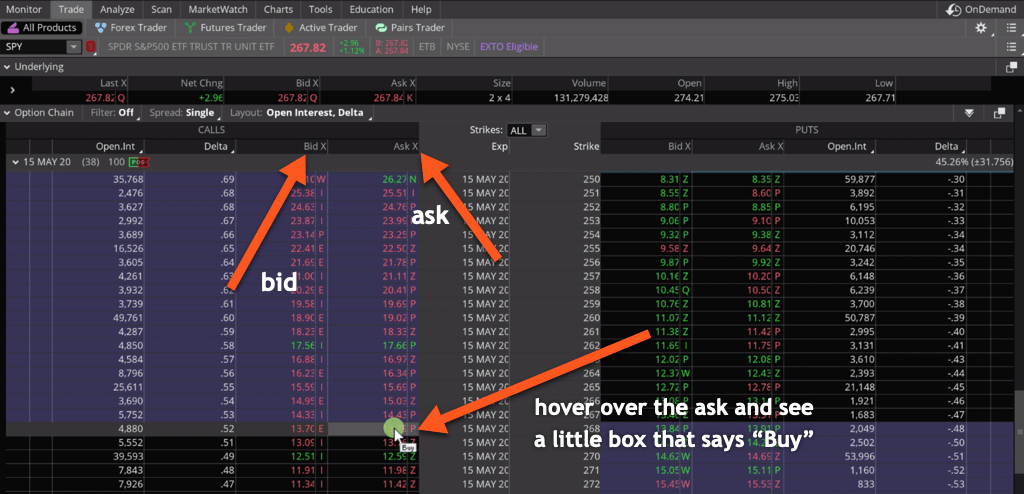

Let’s start with buying a Call. Just left click on the ask, and it will populate buying a Call. To get a visual representation of the trade, just right-click the order, and select “Analyze trade”.
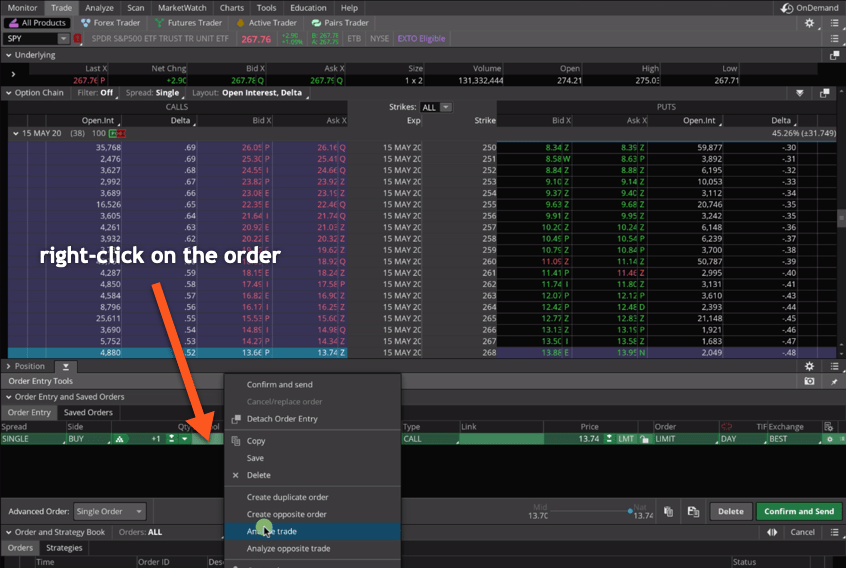

That will take you over to the Analyze screen where you can see a visual representation of the risk profile graph for buying a Call.
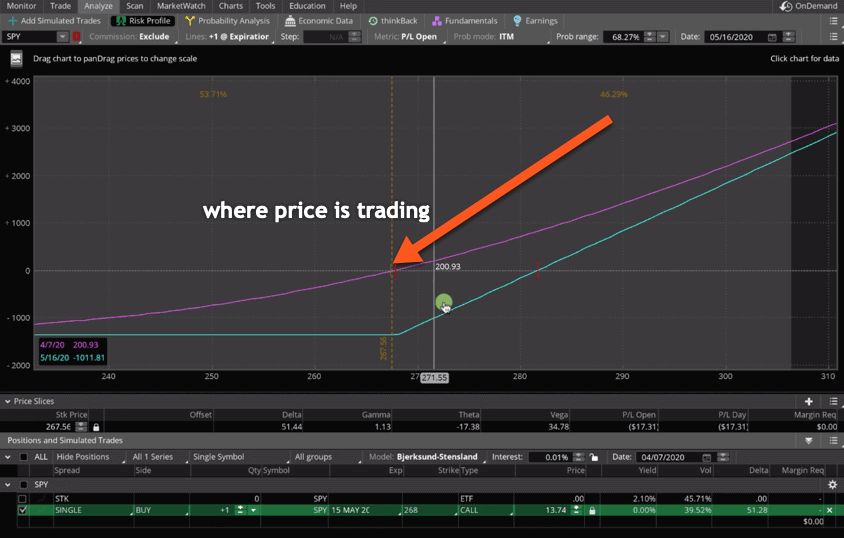

Remember, I mentioned buying a Call is bullish, so we want the price of SPY to go up if we buy a Call. The price in this example is indicated by the numbers at the bottom of the graph. Like I said, price is trading at about $268.
The pink line on the graph represents the current profit or loss in this trade. We haven’t placed the trade, so we have no profit or no loss on the trade yet.
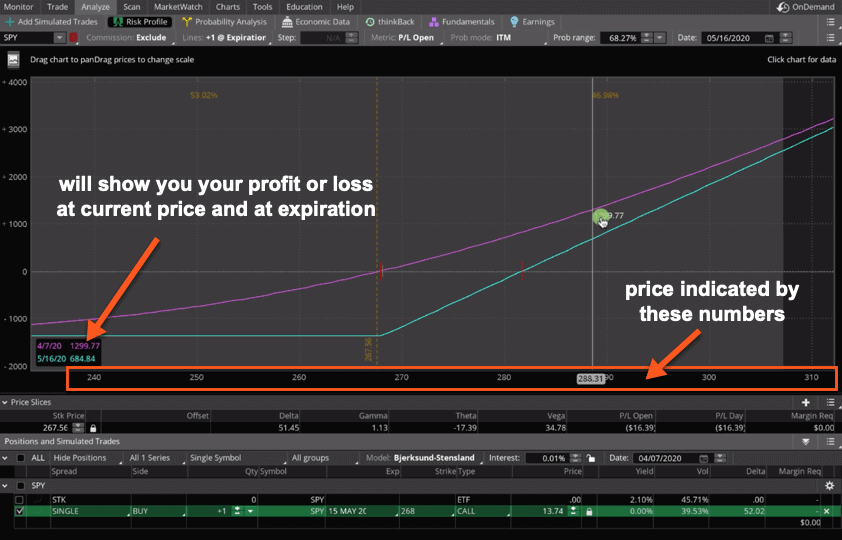
The teal line represents what the profit or loss would be at expiration. If you keep your eye on the box in the bottom left corner of the graph, you’ll see as you move your mouse around, that the P & L (profit and loss) of both the pink (current P & L) line and the teal (P & L at expiration) line give you the values of what would be represented by your profit or loss at these different price points.

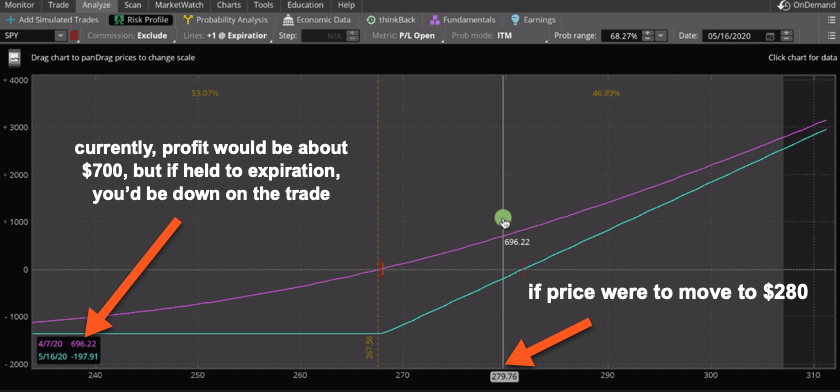
If you bought this Call today and price moved sharply up to $280, you can see that you’d be up about $700 on this trade. However, if you held this trade through time and the price made it up to $280 but you are right at expiration, you would actually be down on the trade. Again, P & L at expiration is indicated by the teal number in the box down in the left corner of the graph.

Why the difference between a move today versus a move at expiration? Well, the difference is because options have time decay. Because options expire at some point in the future, they are worth more today than they are as you get closer and closer to expiration. They start to lose value as you get closer to expiration. That is the major drawback of buying options.
For example, if price stayed right where it’s at all the way until expiration, you would actually lose $1,374. Remember we’re paying 13.74 or $1,374 for this option.
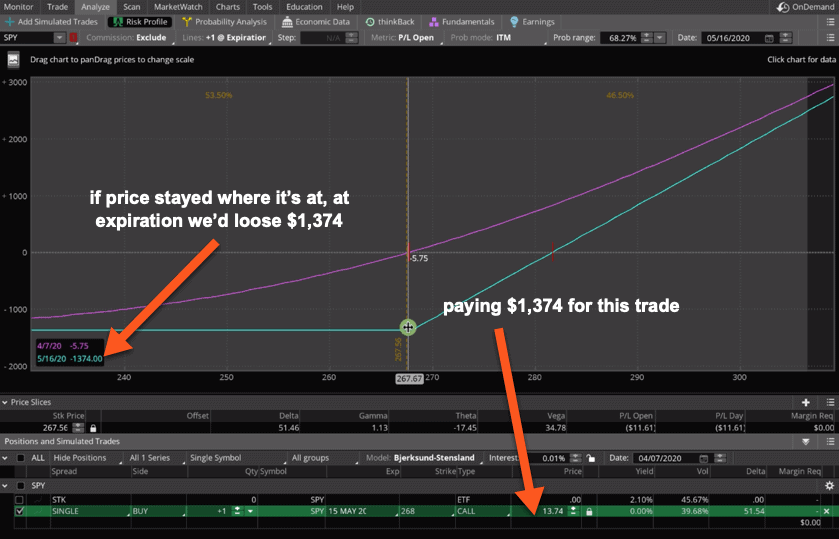

You can make money, but price has to move higher and it has to do it relatively quick to make money buying a Call.
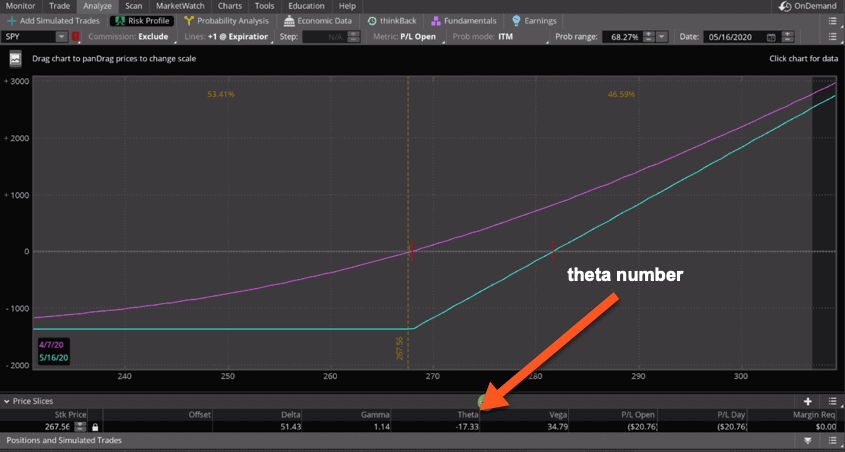
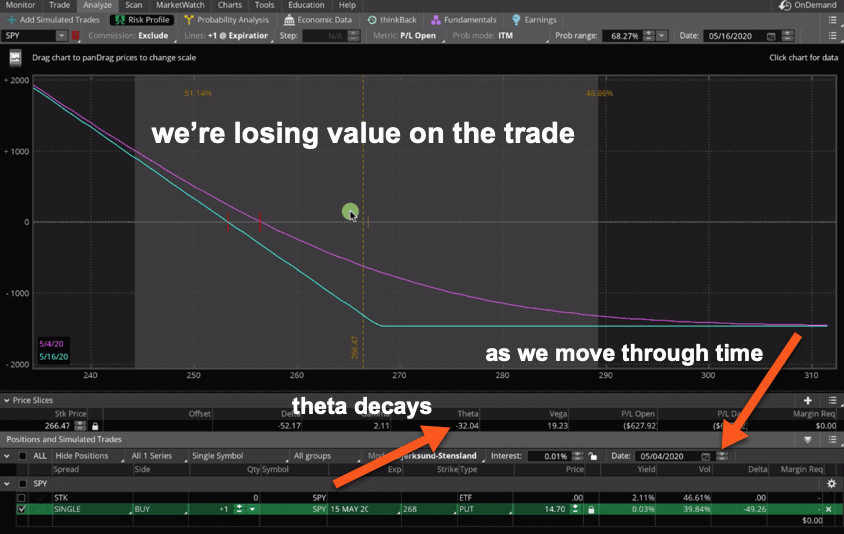
The last thing I want to point out before we move on to the next example is theta. Theta is one of the Greeks that we use to track theoretical values of options. I’m not going to go too deep in this today because it’s beyond the scope of this video; however, the one thing I do want to point out is you’ll notice that theta in this case is negative. It’s about -$17.50. What that means is that at the current price level, this option is going to be losing about $17.50 every day.

Remember, that’s just a representative snapshot of today. If we use our theoretical calendar and we move through time, you can see that theta accelerates how negative it gets. If you watch the pink line, our current P & L, as we move through time and get closer to expiration and theta decays, our option is losing value and now we have to make a further move in price just to make a profit on this trade.
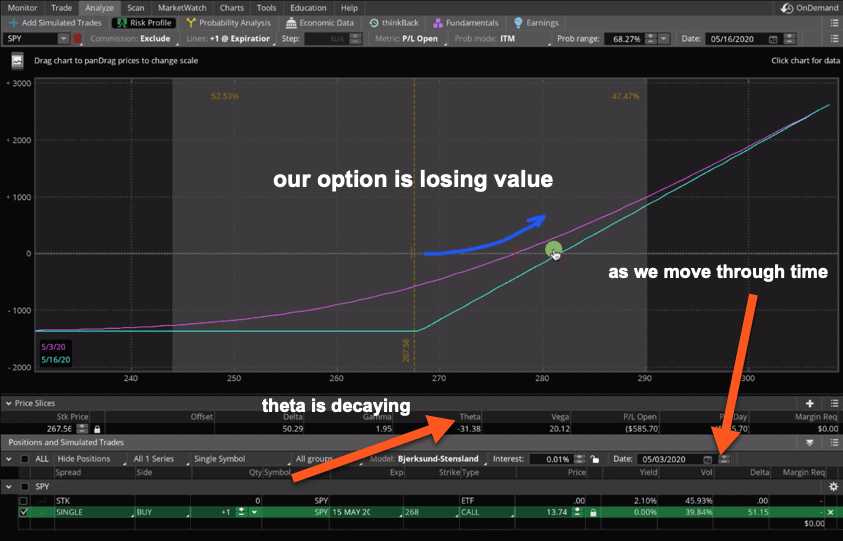

You can think about it from a standpoint of the quicker you can make a move in your favored direction, the more money you’re going to make with this strategy, but it’s got to happen quickly because you’ve got time working against you.
Selling a Call
Let’s go back to the Trade tab and show an example of selling a Call. This is kind of confusing at first, but you can actually sell a Call to open a trade. Most people think when you’re investing or trading that you have to buy low and sell high to profit. In this case, we’re actually selling the contract to open and we want to buy it back for a lower price and keep the difference.
This is the visual representation of selling a Call, or what we also call a Short Call. You can see that we’re using the same strike price, the 268, right at-the-money. You’ll notice is the graph is essentially an inverse of the Long Call that we just looked at. The pink line still represents the current P & L and the teal line still represents your P & L at expiration.
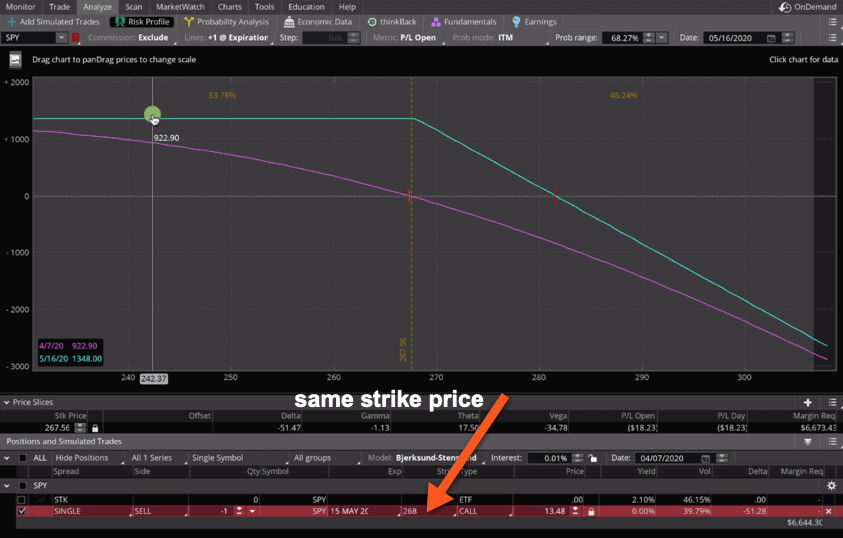

If we move our theoretical calendar through time, now you’re seeing your P & L line actually go up. When you sell options, when you sell a Call, the time decay is actually working in your favor. The closer and closer it gets to expiration, our profit is actually going up. If price stayed exactly where it is right now, all the way to expiration, you can see we would keep this entire premium of $1,348.
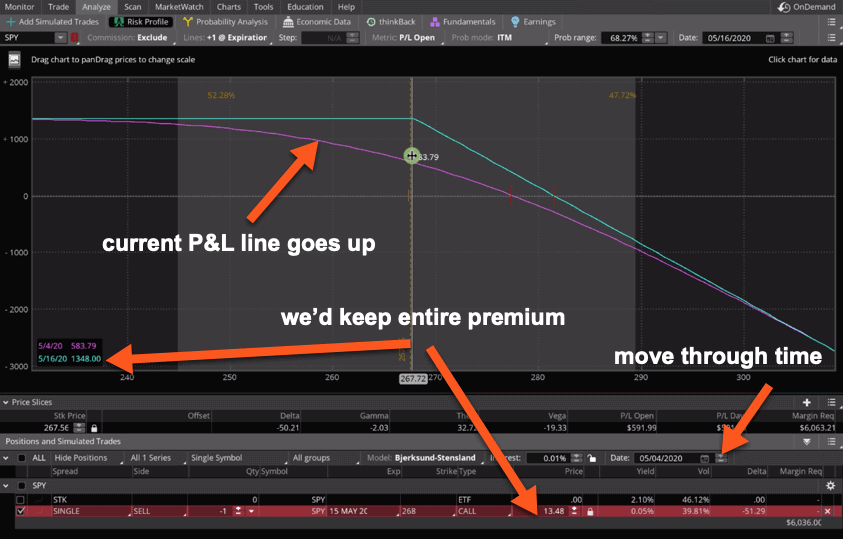

Remember, selling Calls is bearish. We want the price of the stock to go down. If price were to move down, we’re going to continue to have a better probability of keeping that entire premium ($1,348).
If we set our price slice to break-even, you’ll see at entry we have over a 67% probability of success that we’ll make money on this trade and only a 32% chance that we’ll lose money.
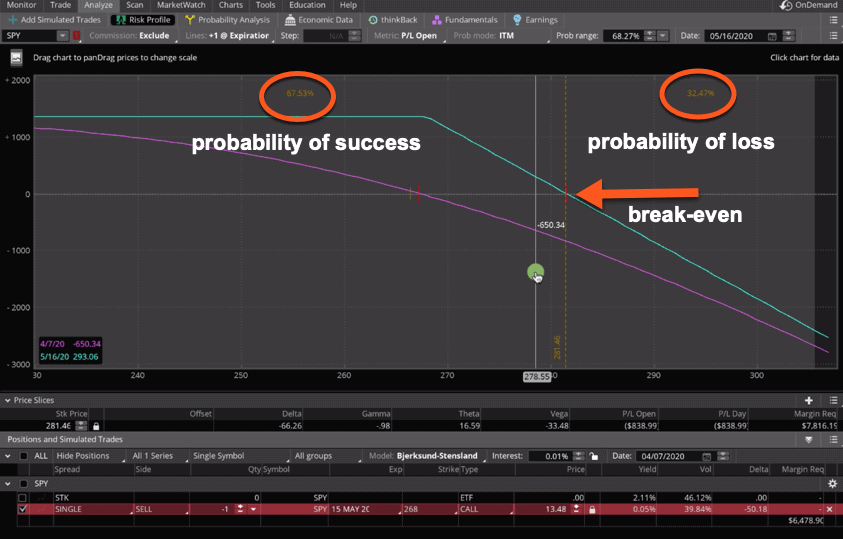

Selling options is a much higher probability trade. The main difference is that your gains or your potential profit is capped; whereas with a long option, you have theoretically unlimited potential profits.
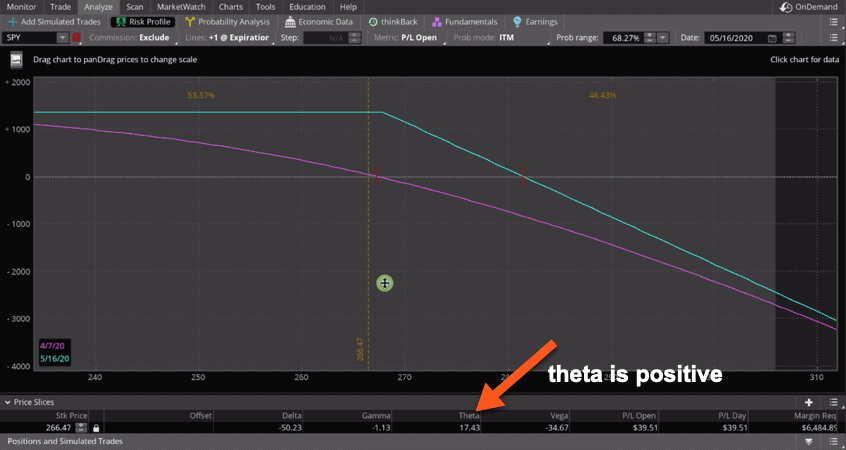
The other thing you’ll notice, if I put the price slice back on the current price is that that the theta component that I mentioned before is actually a positive number. We’re making $17 every day if price and volatility were to stay exactly where they are. If we move through time on our theoretical calendar, you’d see the profit line moves higher and our theta number accelerates. We’re actually making more and more money each day as we stay in this trade.

Buying a Put
Now let’s look at buying a Put. We’re sticking with the same exact strike, the 268. We’re going to buy (click on the ask).
I’ll analyze the trade, by right-clicking the order and clicking “Analyze trade”. This will populate the visual representation of buying a Put.
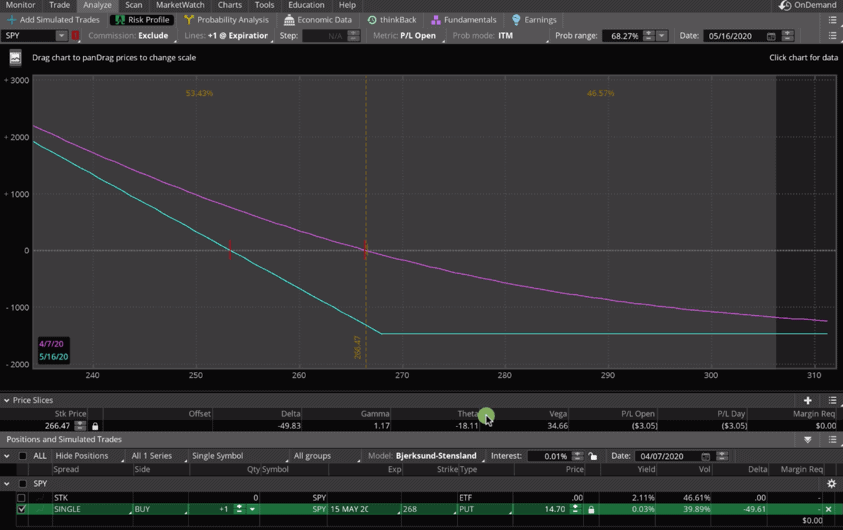

Remember, when we buy a Put, we are bearish. We want the price of the stock to go down. Similar to buying a Call, theta is negative. As we move through time, our P & L line is actually going to go down because our option is losing value the closer we get to expiration. At this point, you have to make a quick move, a bigger move to get into profit territory.

If we move our calendar back to today’s date and we set our price slice at the break-even at expiration, you will also notice that you have about a 60% chance of losing money if you held this to expiration and about a 40% chance of making money if you held this trade all the expiration. Those odds are not in your favor.
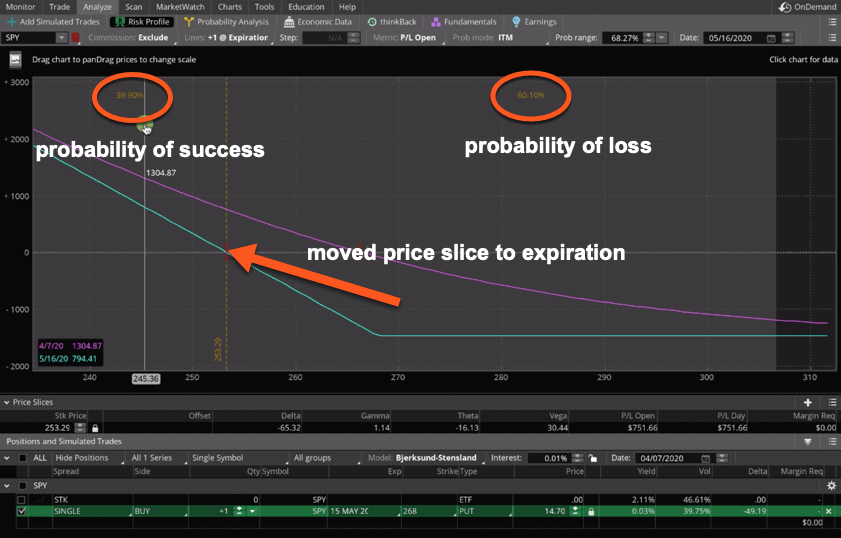

The tradeoff for having a lower probability of profit is that you have an unlimited profit potential.
Selling a Put
Using the same strike, the 268, we’re going to sell a Put.
Again, our risk profile graph is basically an inverse of the last one that we looked at because remember, if we’re selling a Put, we are bullish. We want the stock to go higher and since we’re selling, our theta number is positive. If we moved through our theoretical time, you’d see that the theta number accelerates because now we have the time decay working in our favor and selling options gives us a higher probability of success.
With our hash mark at the break-even point, you see in this case we’ve got about a 60% probability of making money on the trade and just a 40% probability of losing.
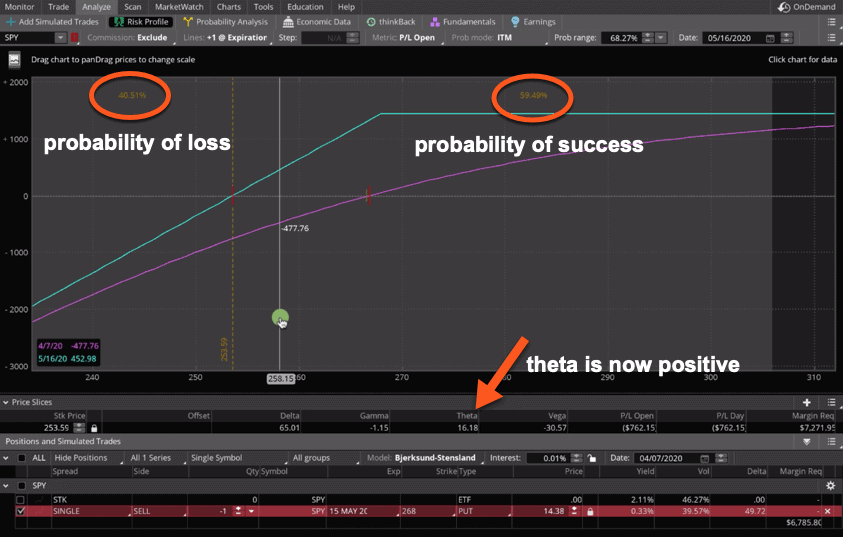

Because we have a higher probability of success, you’ll see that we do have a cap on the amount of money that we can make on this trade.
Just remember, there’s always a relationship between risk versus reward. Lower risk, higher probability means lower reward. If you have a lower probability, you might have a higher potential for profit.
Summary
There are a lot of different strategies and ways that you can utilize the selling and buying of Puts and Calls. At NavigationTrading, it’s not that we never buy options, but overall we prefer to be net sellers of options where we have a higher probability of success and we have the time value, or the theta component, working in our favor. That way, we’re continuing to make more money as we get closer and closer to that expiration date as opposed to losing money.
That concludes our lesson on the difference between Calls and Puts. If you have any questions, feel free to drop us a line in our TradeHacker Community.
See You there!
-The NavigationTrading Team


Follow