
Hey NavigationTraders!
Welcome to this lesson from NavigationTrading.
In this video, I want to talk about the top five options trading strategies that we use to generate monthly income. To go over these strategies, I’ll be referencing our eBook, The Trade Hacker’s Ultimate Playbook, 19 Bulletproof Strategies to Trade in Any Market.
We’re going to be focusing on the five core income strategies, but there are actually seven strategies to use in a bull market, and seven strategies to use in a bear market. Once we get to the end, I’ll show you where you can get this eBook for free.
#1 Short Strangles
I want to start with the Short Strangle. A Short Strangle is a neutral trade. You don’t care if the stock goes up, down, or sideways. You just want it to stay in a specific range, based on when you enter the trade.
You want to enter Short Strangles when implied volatility is high. We like to enter them between 30-60 days left to expiration.
We’re looking for a profit target between 30-50% of max profit. We never want to hold these trades all the way to expiration. The downside risk is undefined, as well as the upside risk. We’re typically looking at about a 70% probability of profit or more on this strategy.
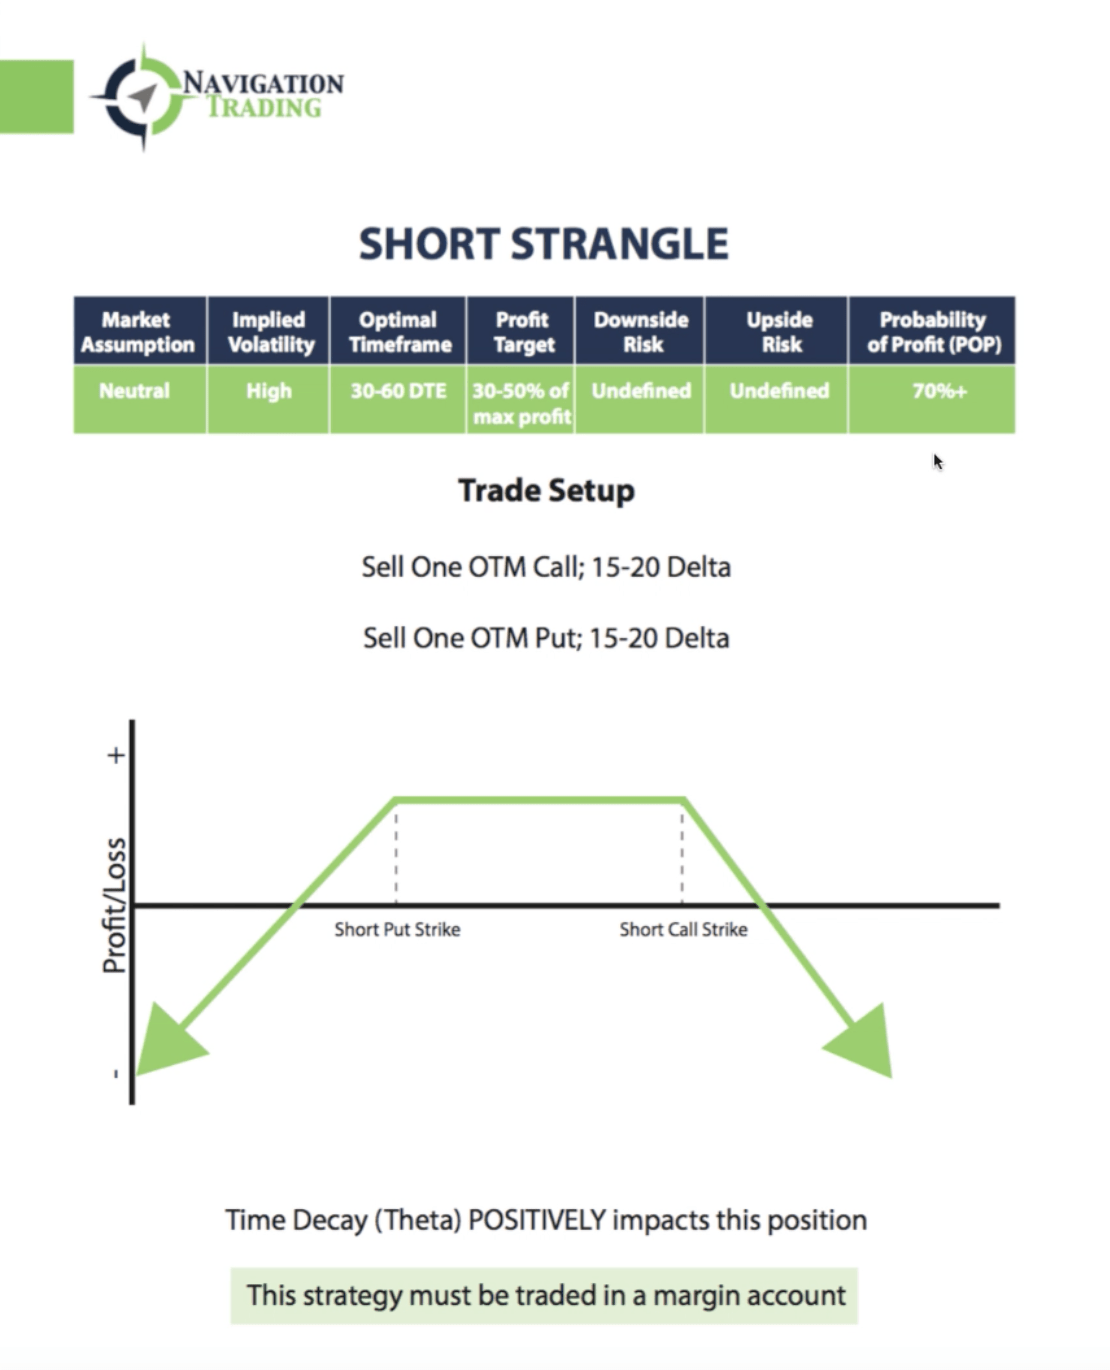

To enter the trade, we’re going to sell one out of the money call. We like to do it around that 15-20 delta, and you’re simultaneously selling one out of the money put in that same 15-20 delta range. The graph above shows how the trade looks from a visual perspective.
The other thing to remember, is that time decay works in your favor. It positively impacts this position. This strategy must be traded in a margin account. However, now tastyworks offers the ability to trade naked calls in your IRA. Learn more here – https://navigationtrading.com/tastyworks
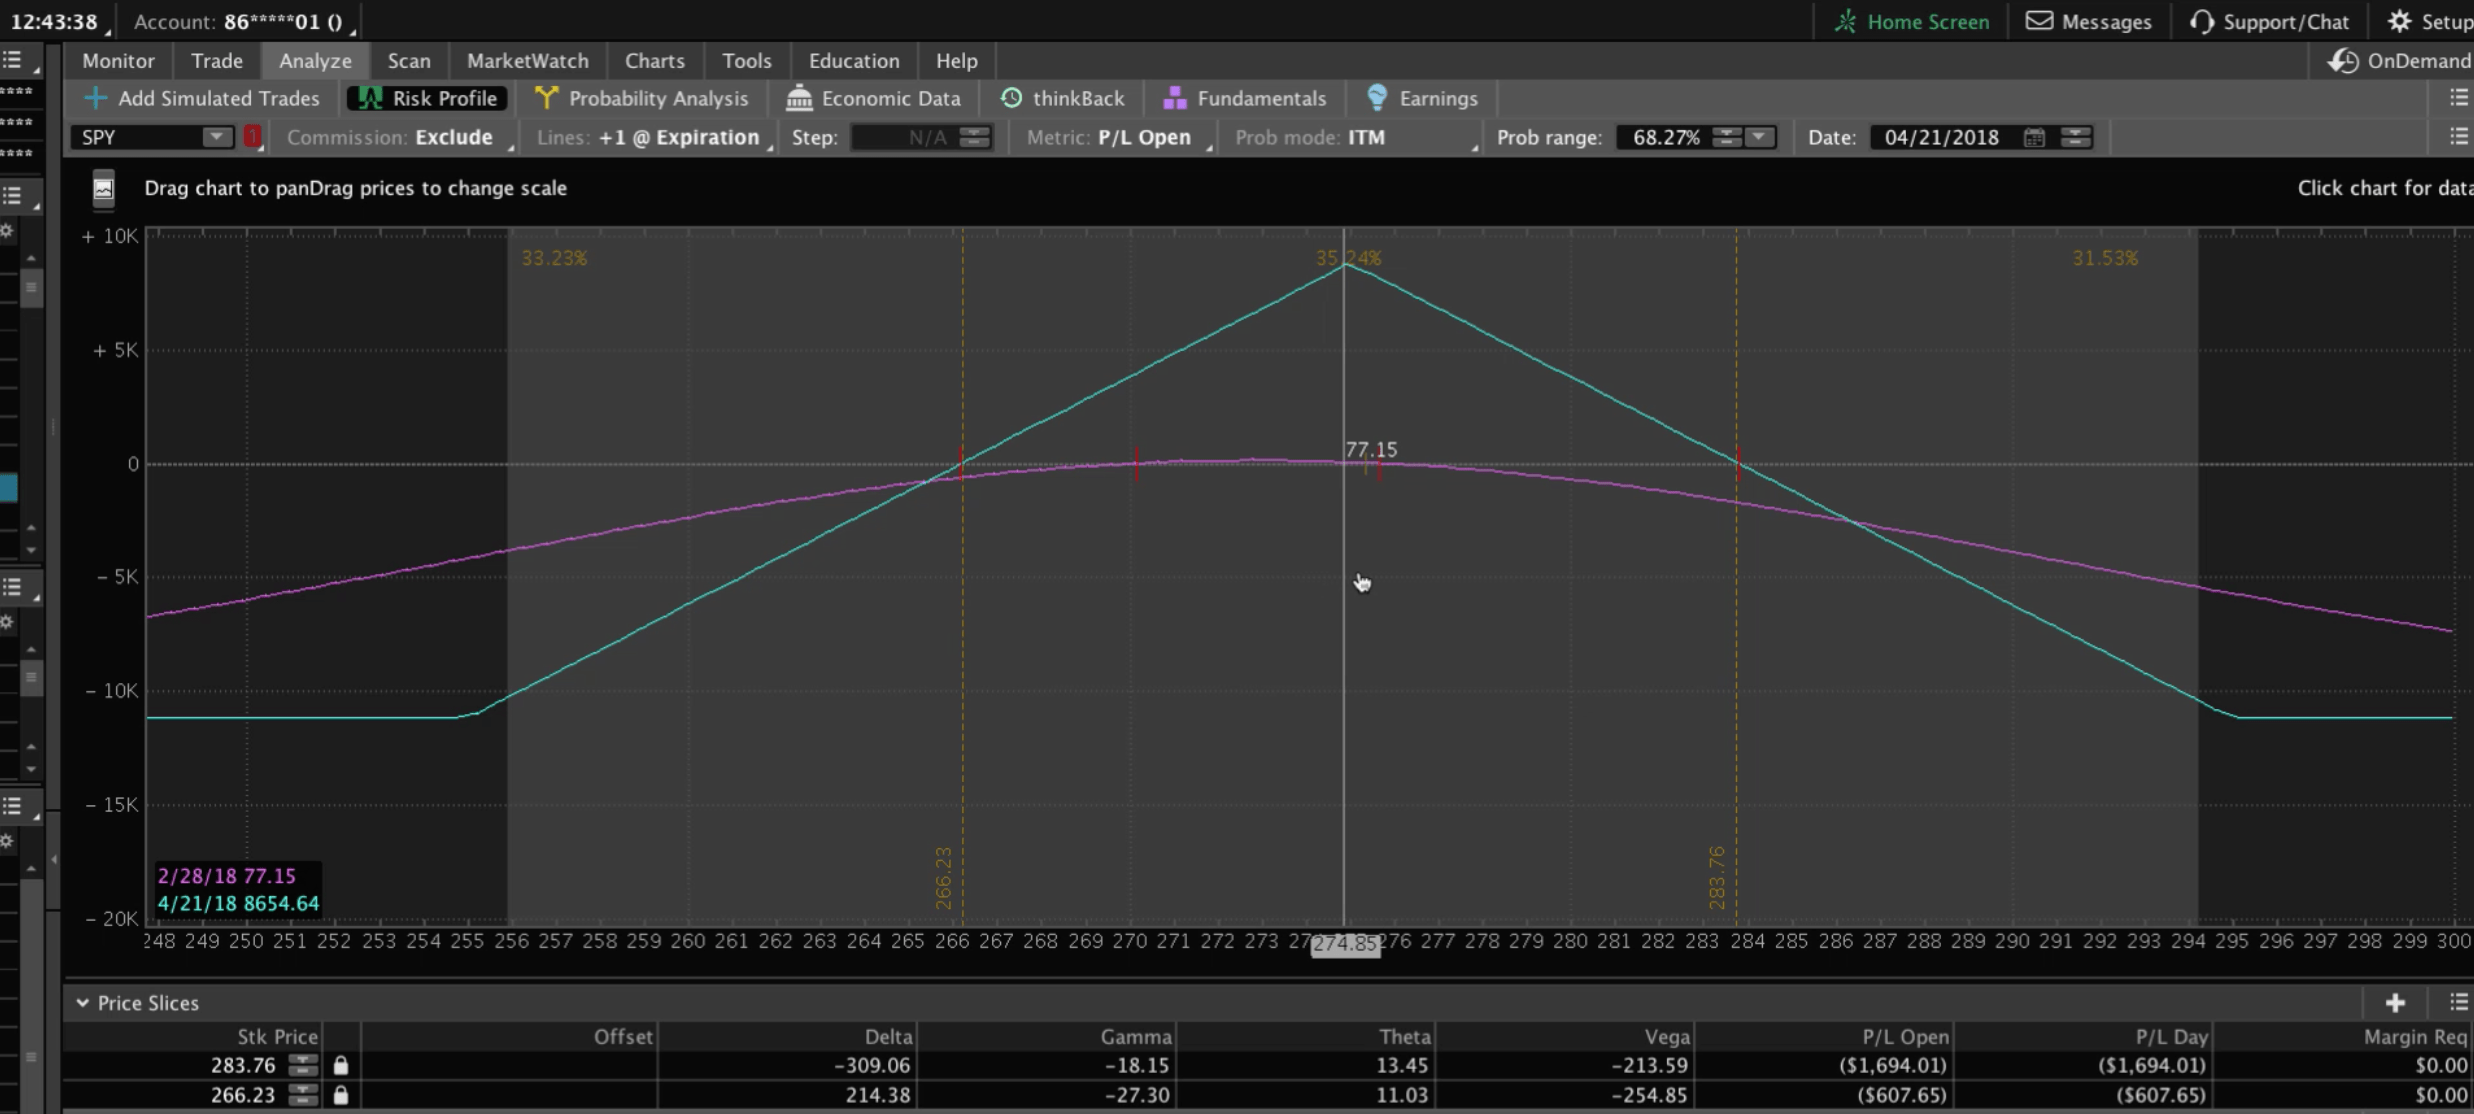
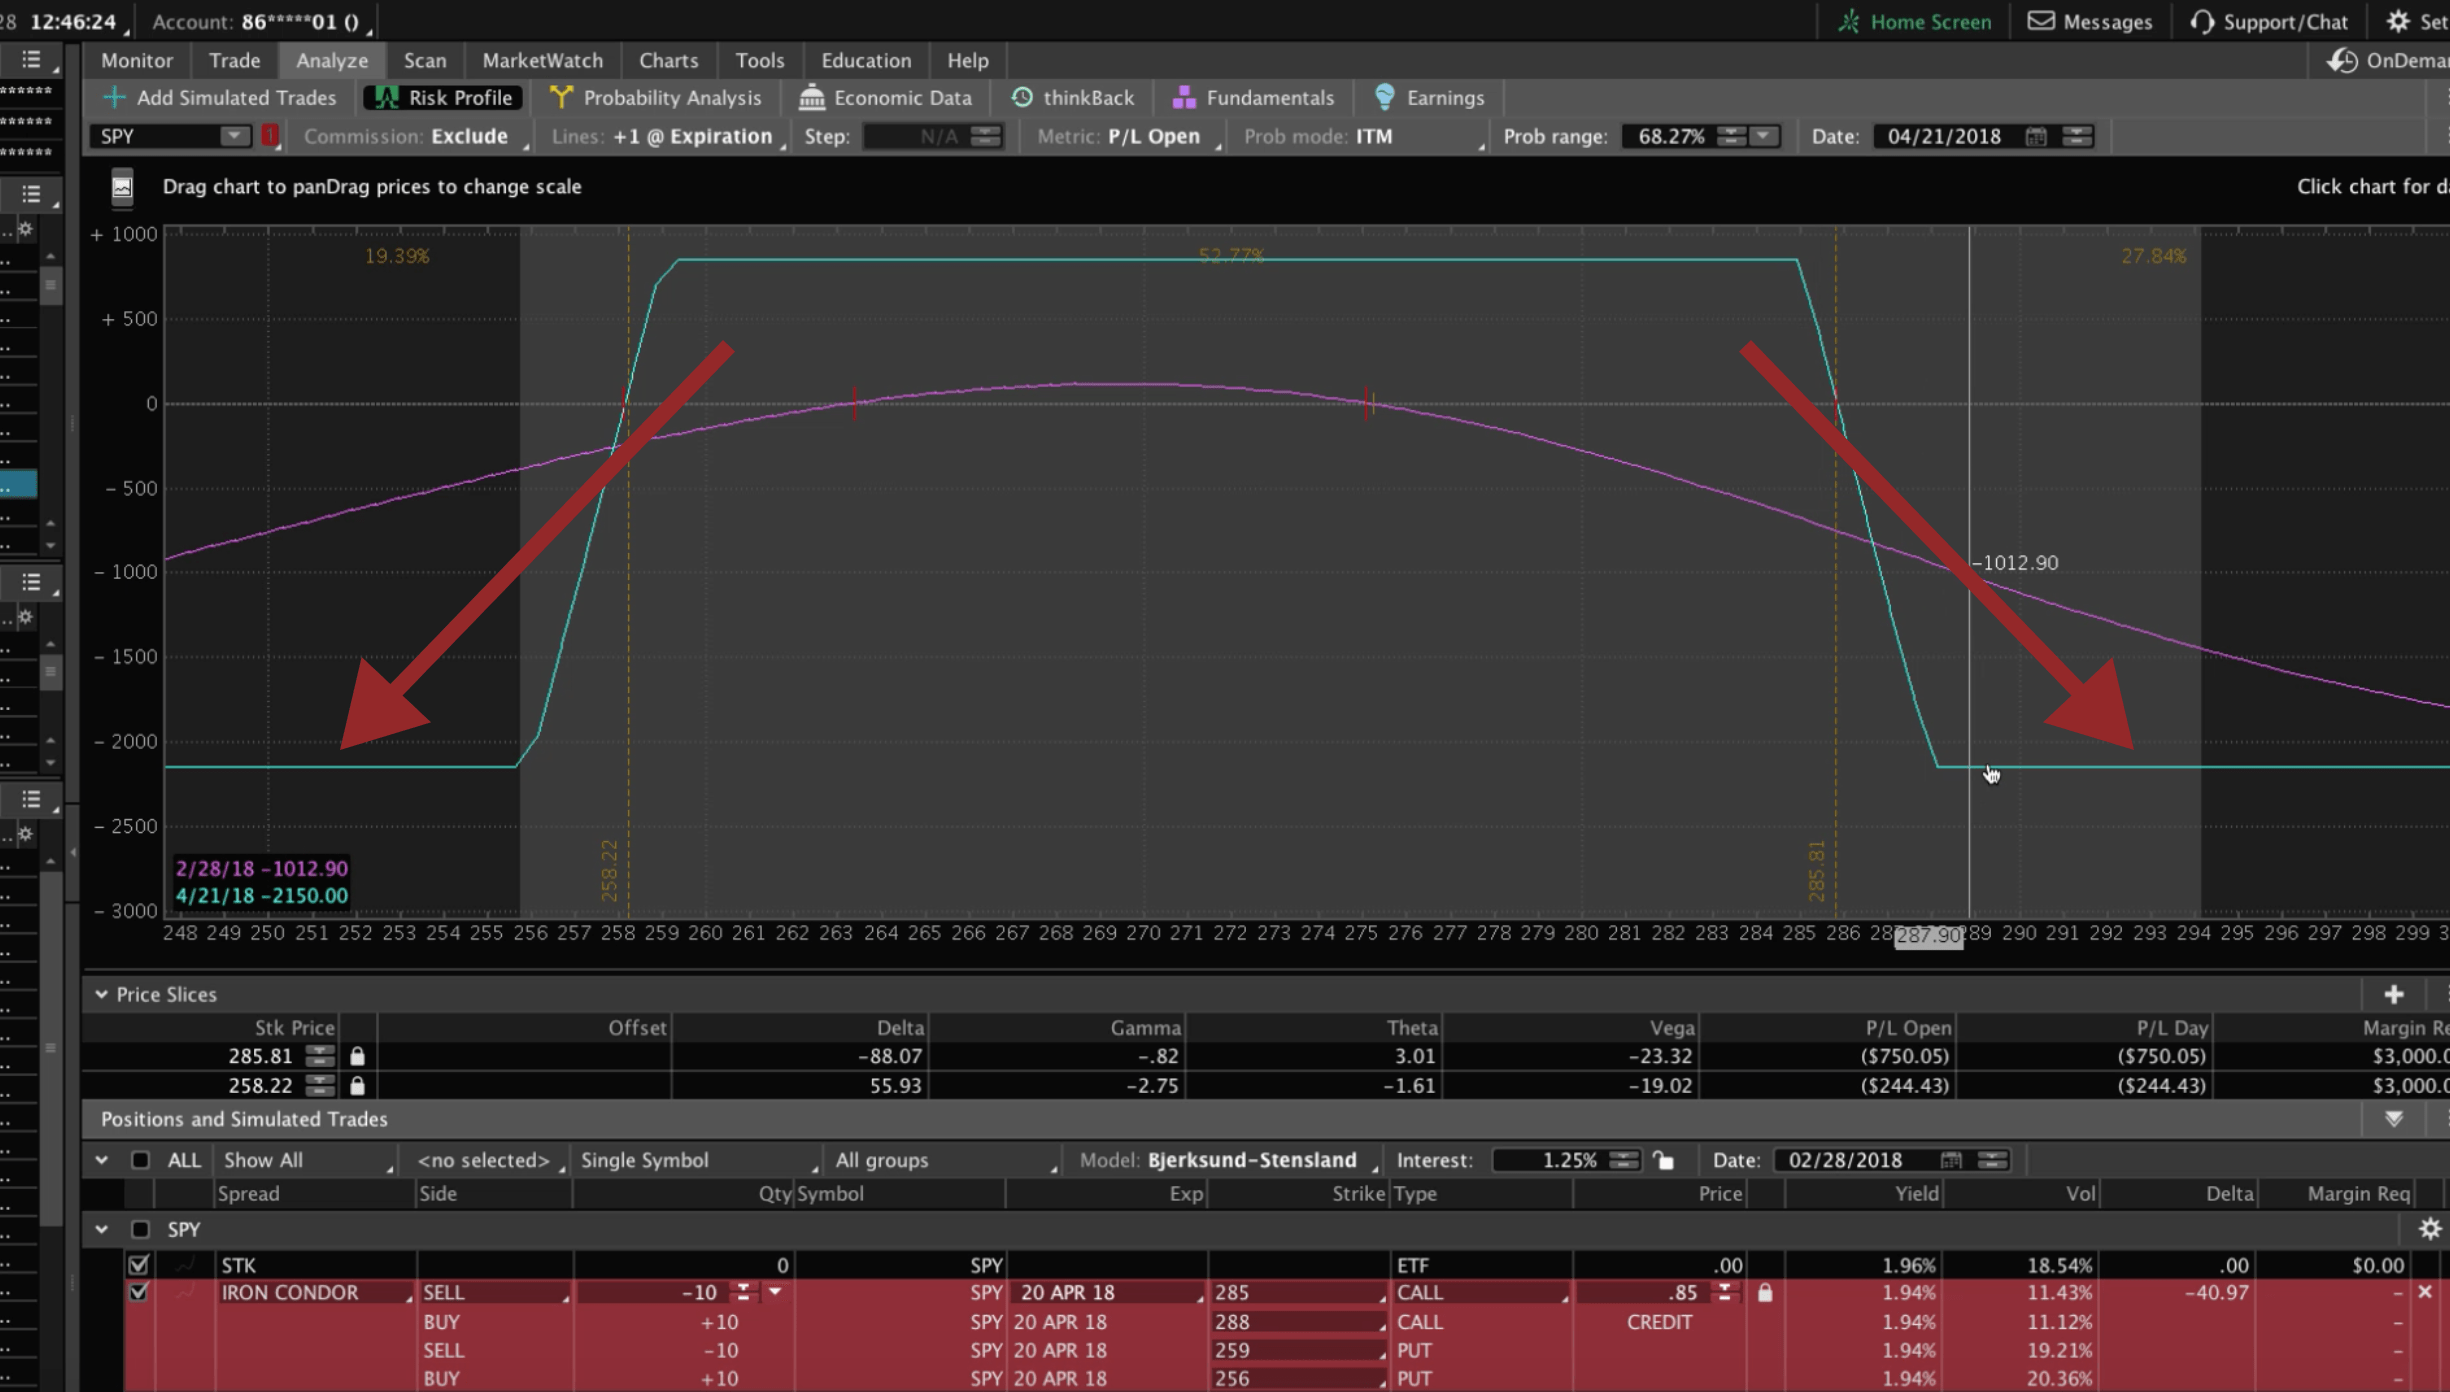
Let’s go to the platform and take a look. As you can see, I’ve already entered this trade and put it in the Analyze tab in thinkorswim. I’ve checked the Strangle down at the bottom of the platform. It shows that we’re doing 10 contracts. As you can see, we’re selling the out of the money call and the out of the money put.
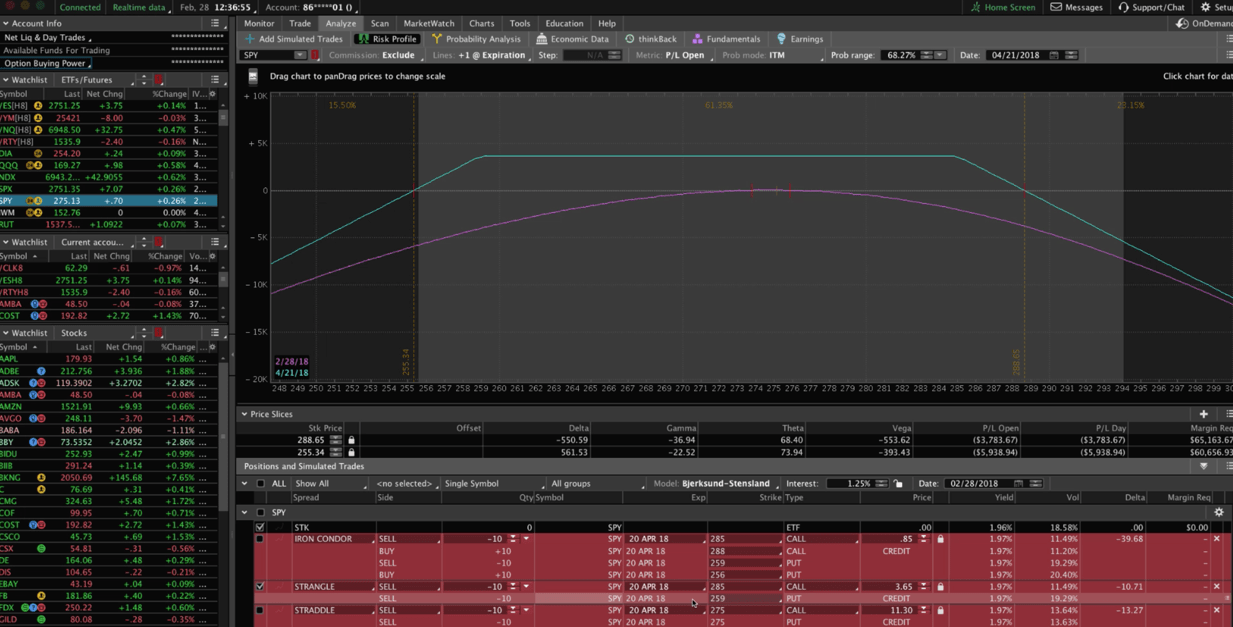

The call strike is at 285. You can see by the bend in the graph off to the right. That annotates the short call. The bend over to the left annotates the short put, which in this case, is at the 259 strike.
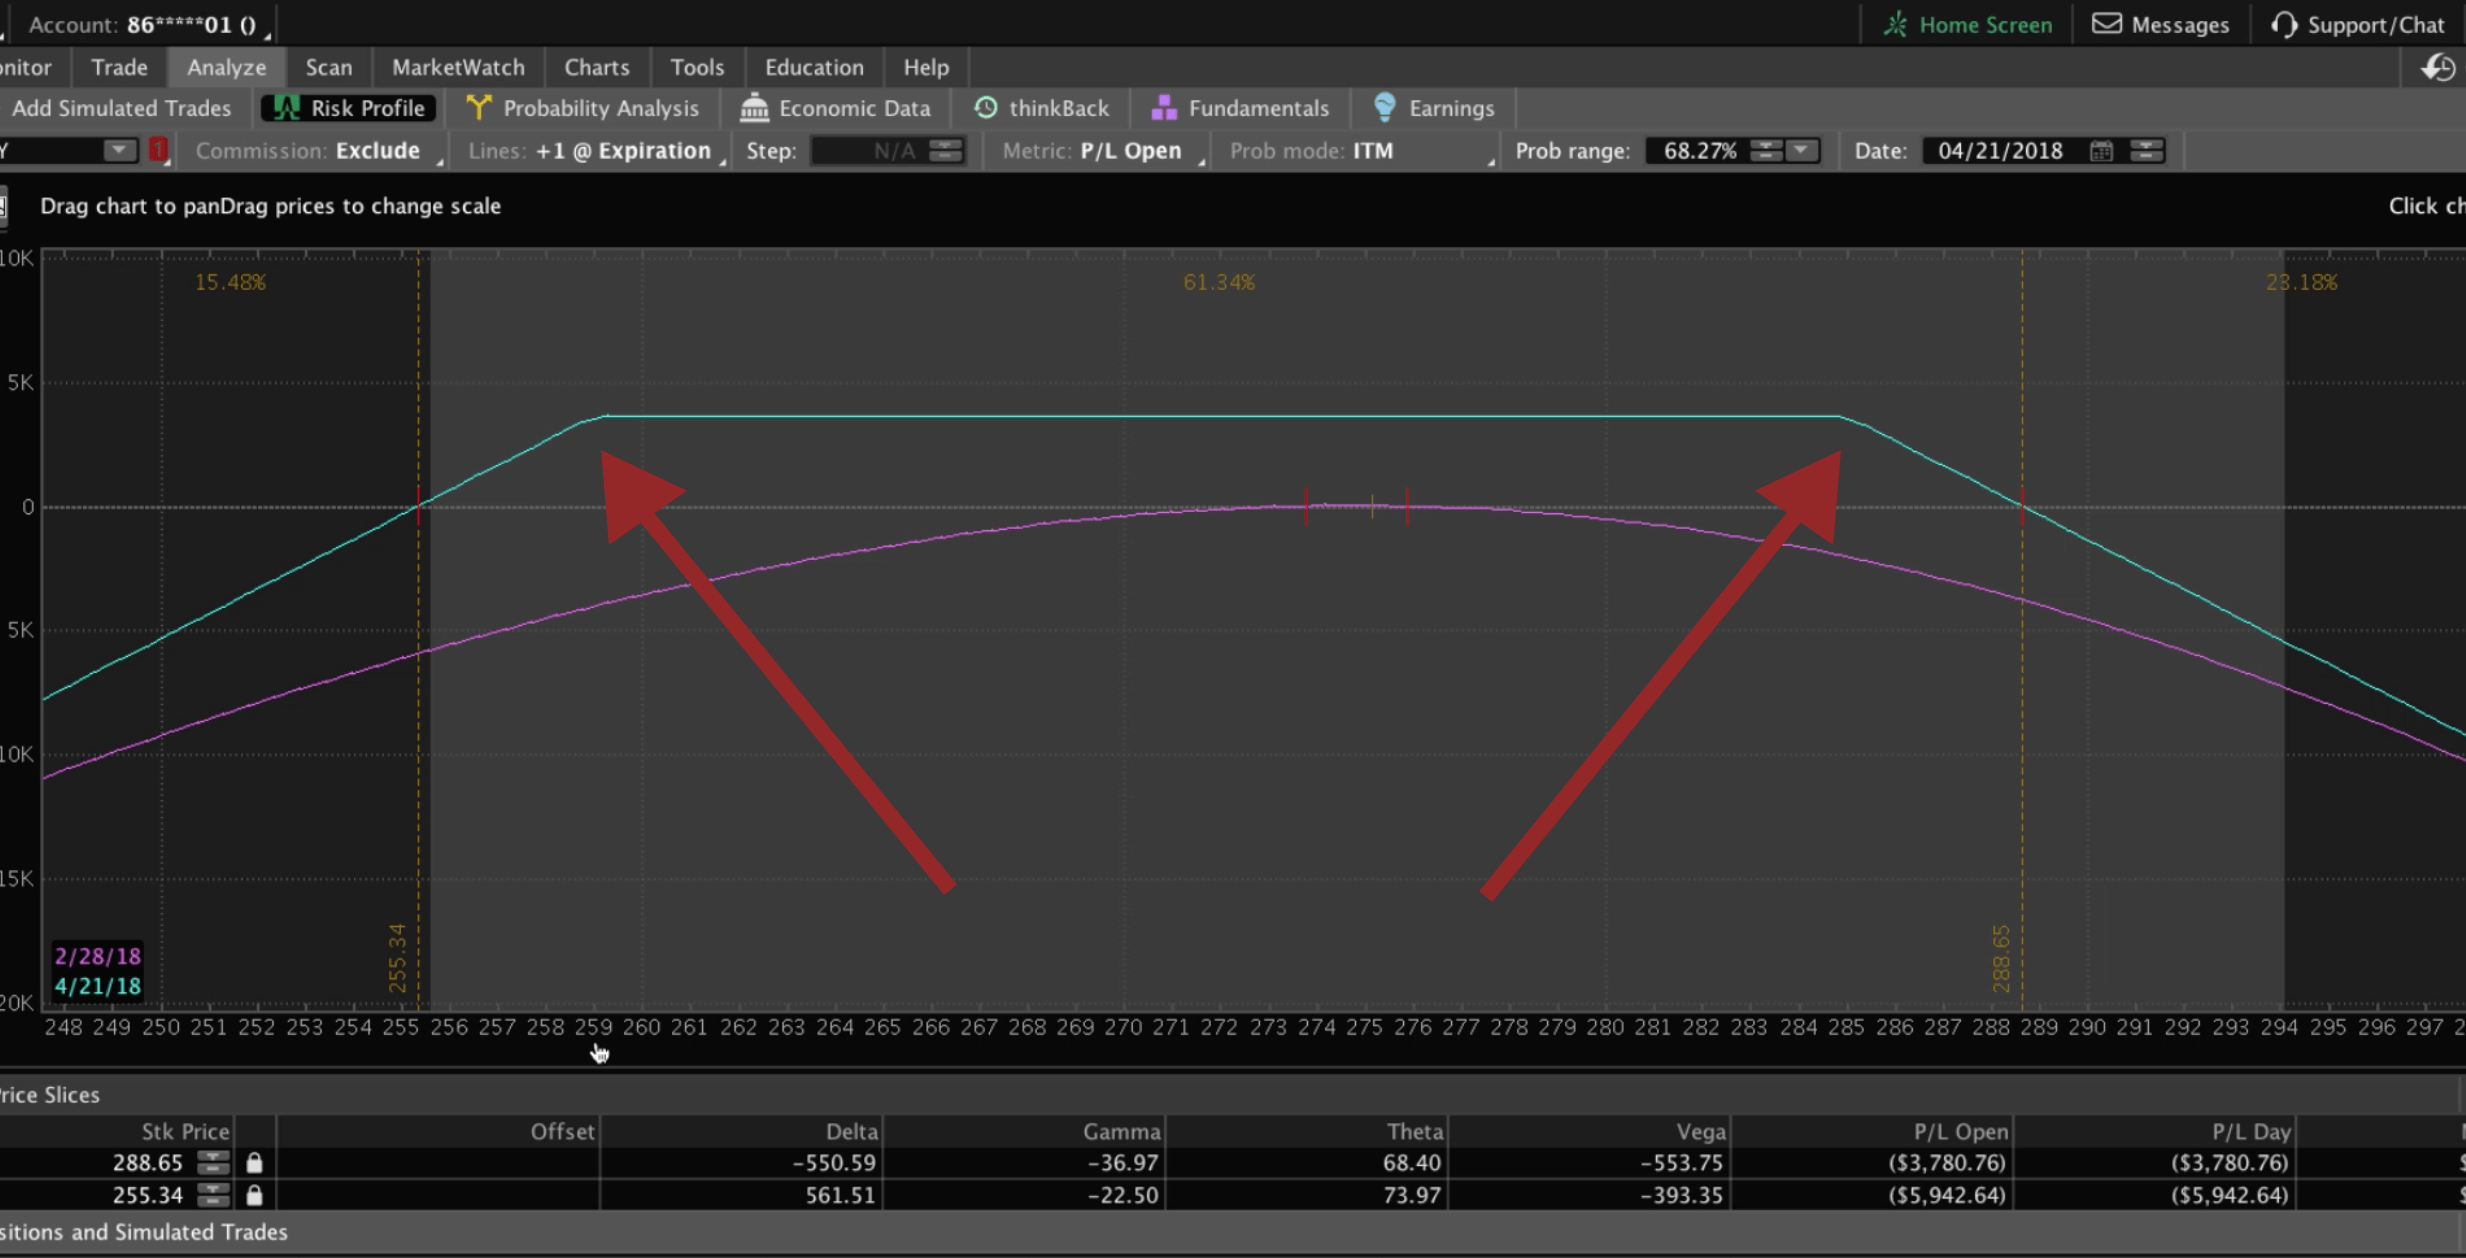

Then, you can set these price slices, to the breakeven point (where it crosses the zero line on your graph). The platform automatically populates what your probability of profit will be, if you hold the trade all the way to expiration.
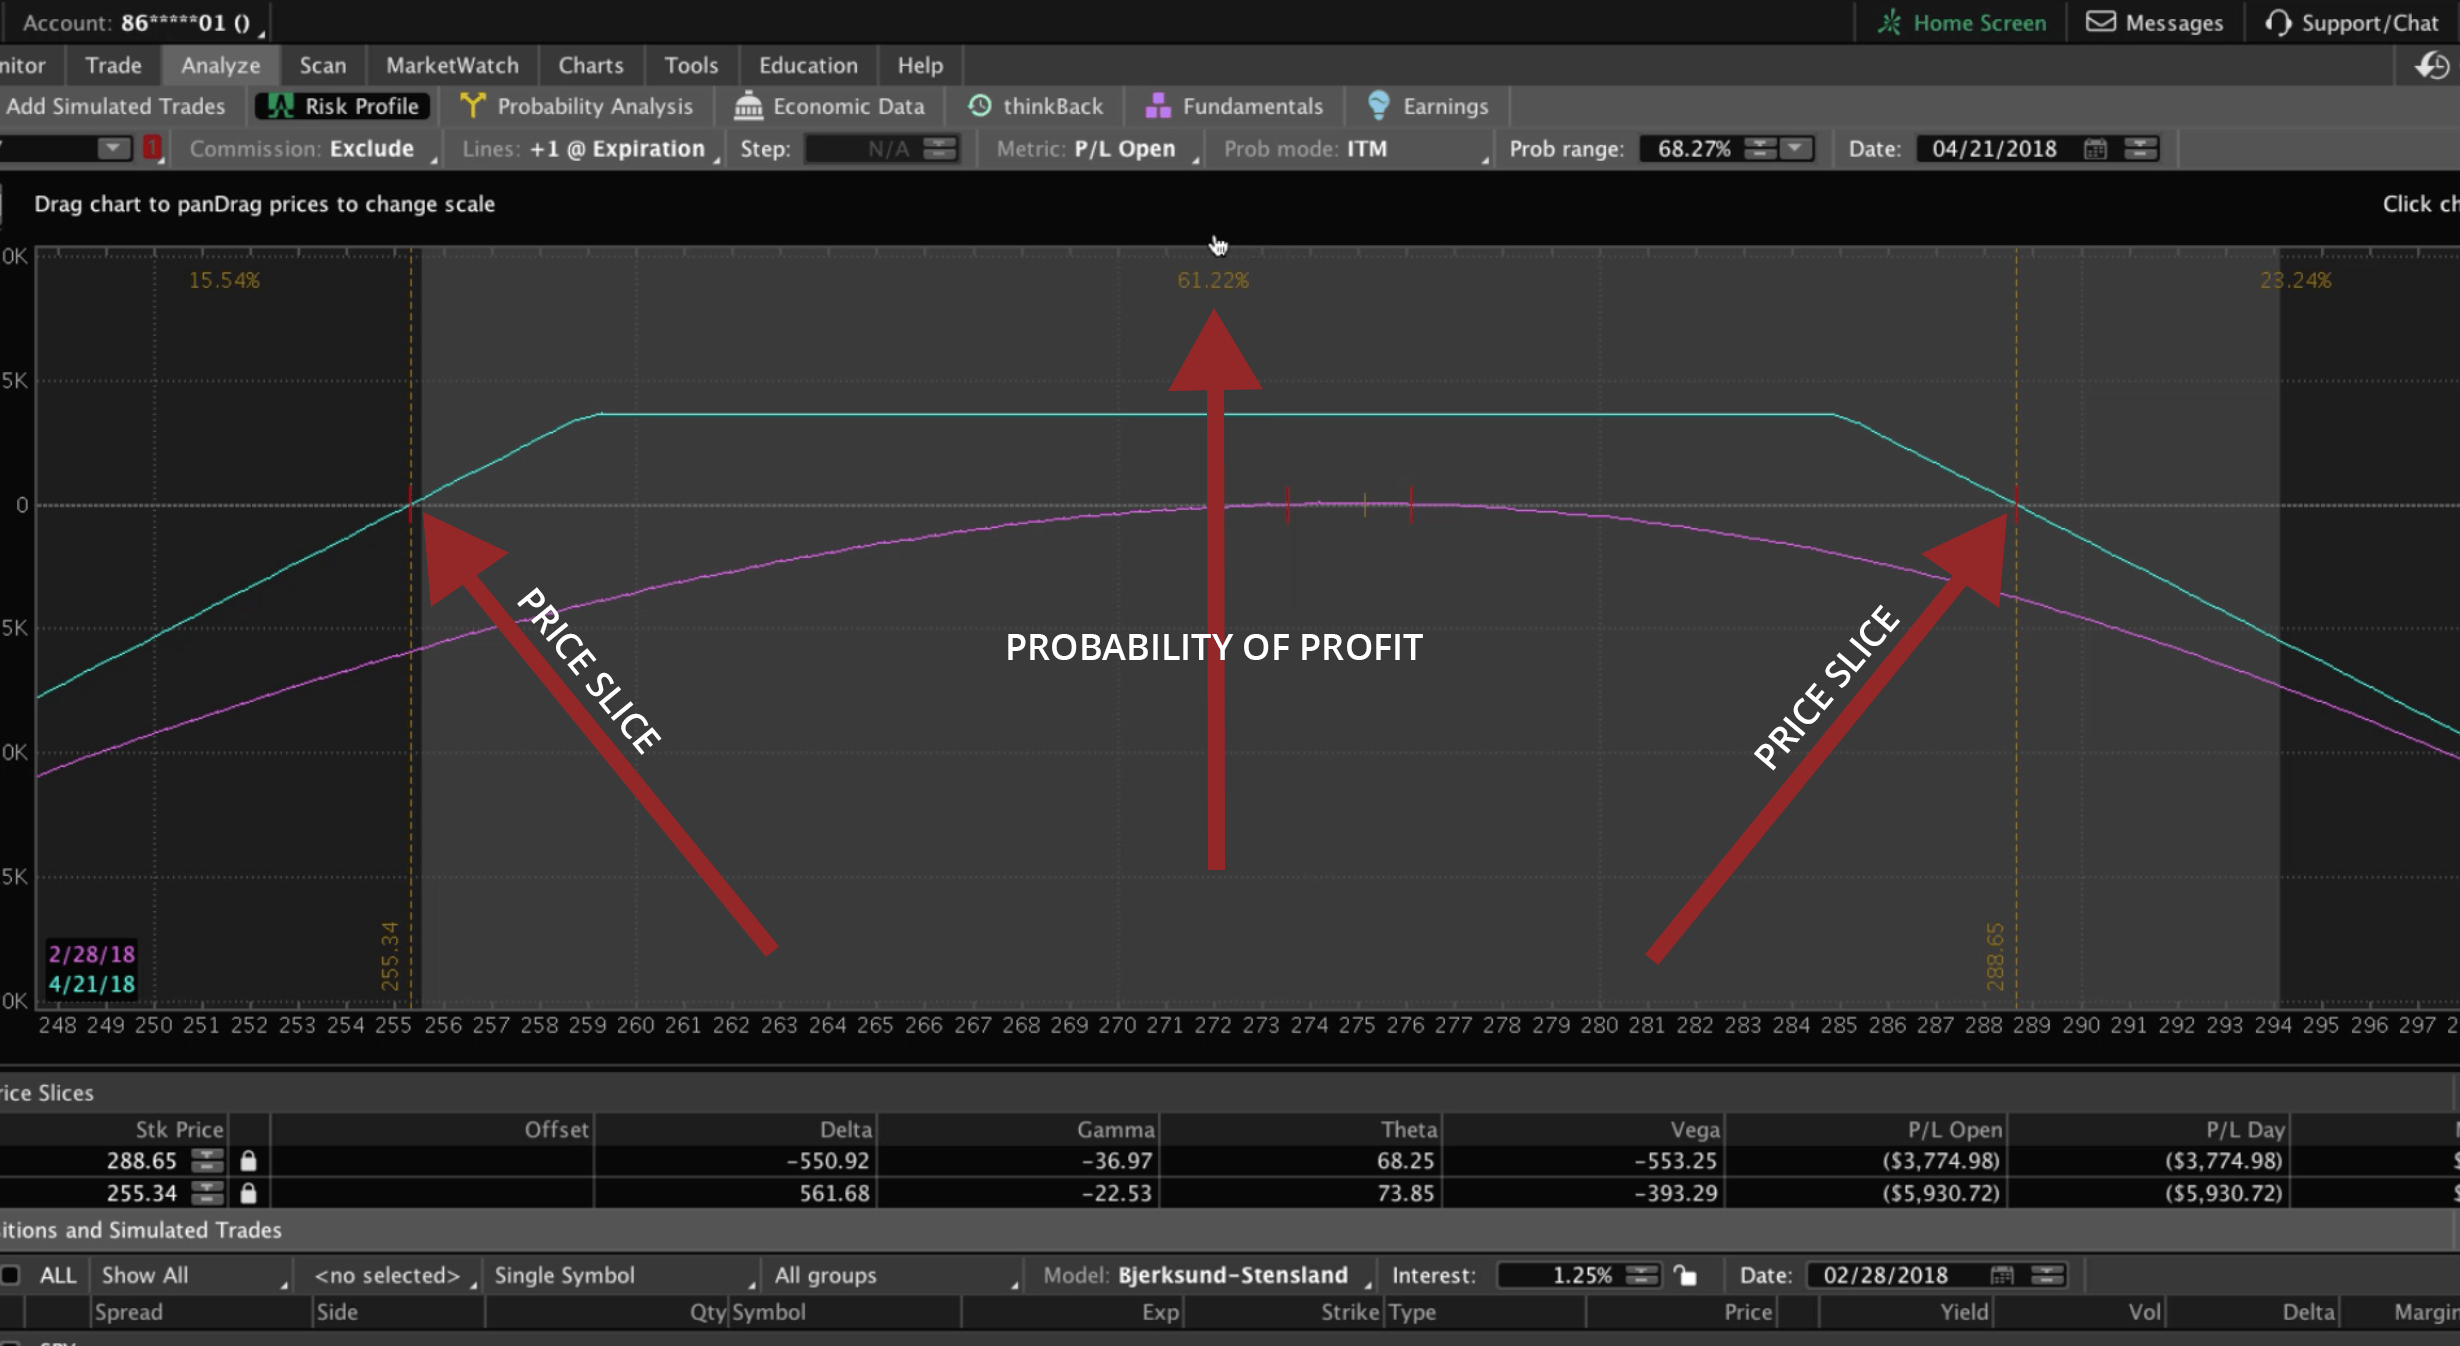

Remember, we’re going to be closing our winners at 30-50% of max profit. So, instead of a 61% probability of profit, we’re actually looking at closer to 80%, 85%, sometimes 90% probability of making money on this trade. If you view the little box in the bottom left corner of the graph, as I hover my mouse, you can see the maximum profit on this trade is $3,650 with our 10 contracts. We’re looking to take somewhere around $1,400-1,600 of profit out of this trade.

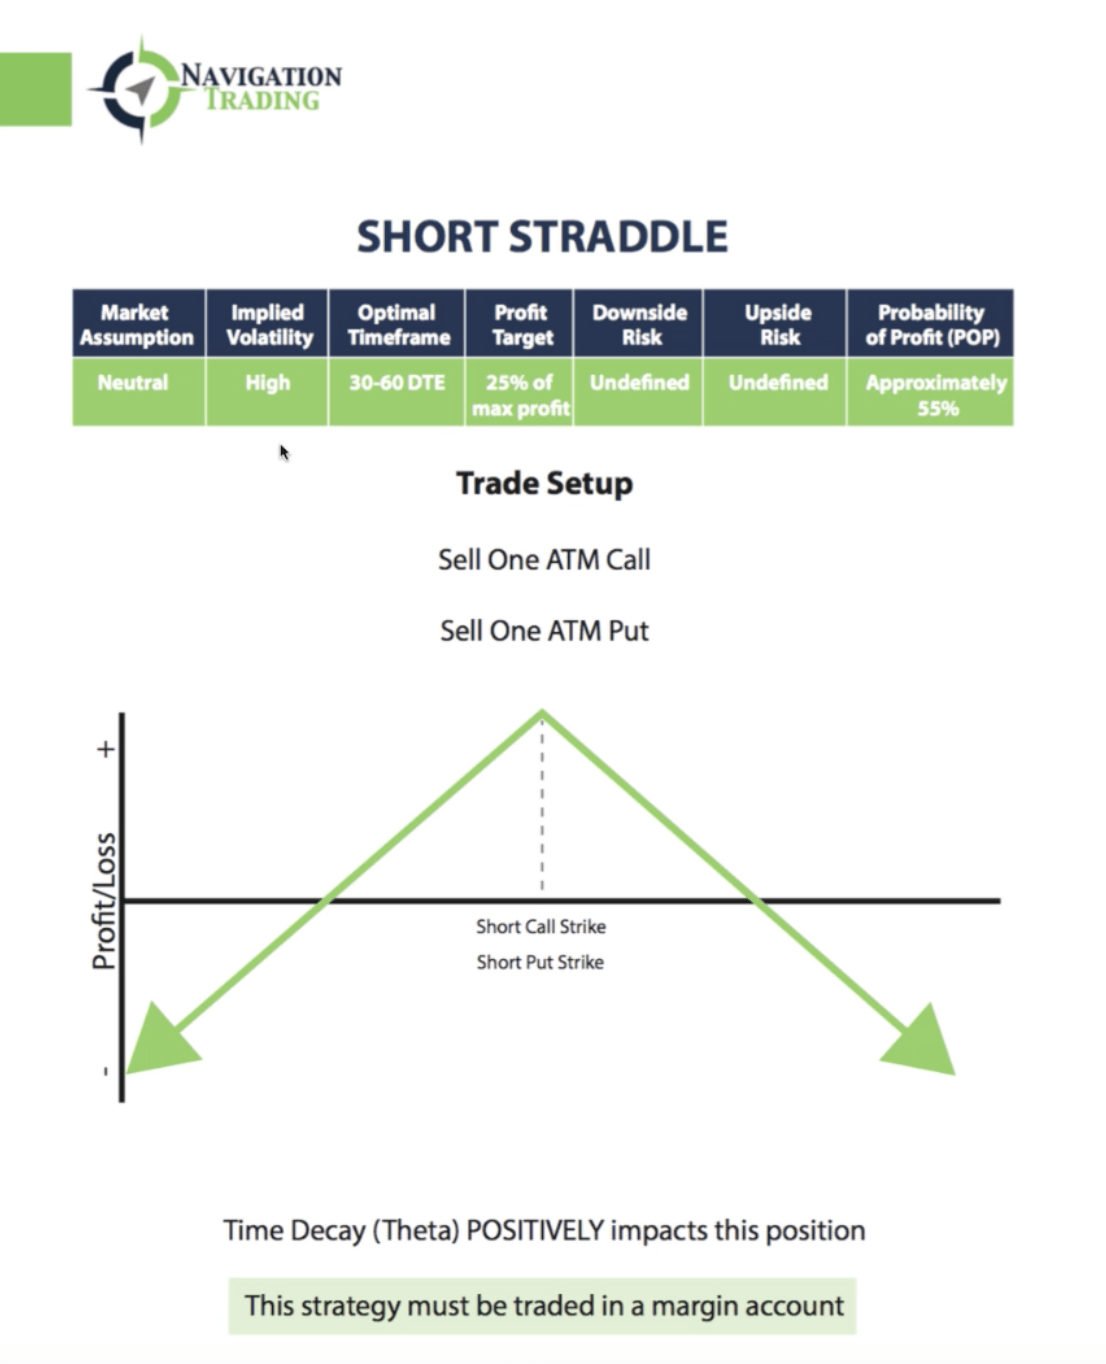
#2 Short Straddles
Let’s bring our strategy eBook back up and take a look at the next strategy, Short Straddles.
Straddles are very similar to Strangles. Our market assumption is still neutral. We want to put these on when implied volatility is high.
We still want to enter with 30-60 days left to expiration.
Our profit target is a little bit smaller. We’re only looking for about 25% of max profit with a Straddle.
The downside and upside risks are undefined.
Our probability of profit is less. When we do a Straddle, we’re selling one at the money call and one at the money put.
The graph below is a visual representation of what Short Straddles look like. Time decay, or THETA is also positive.
Again, just like the Strangle, this strategy must be traded in a margin account. Unless you trade with tastyworks…and in that case, they can be traded in an IRA as well – https://navigationtrading.com/tastyworks

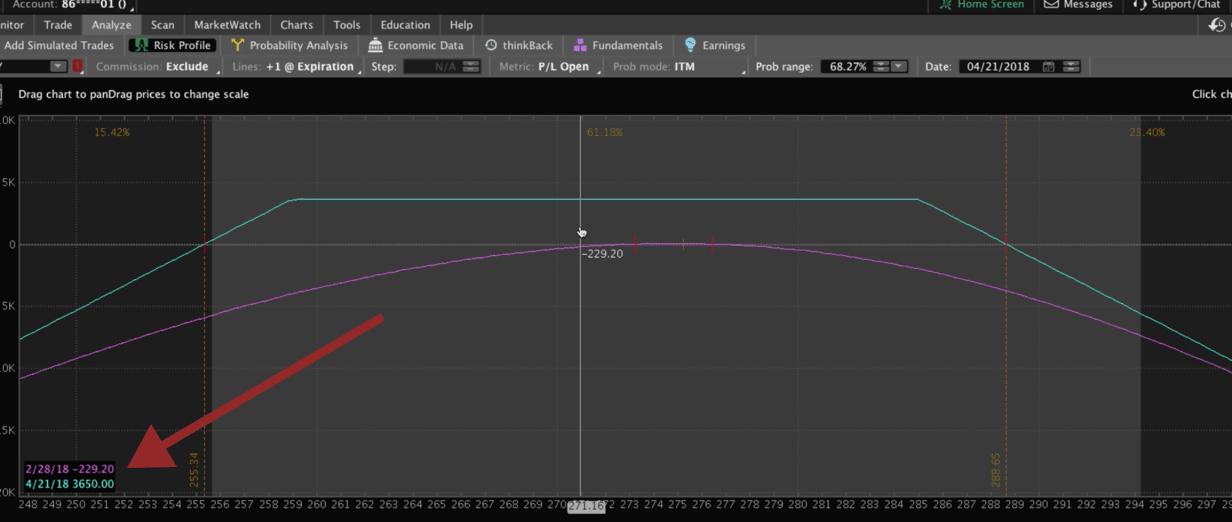
If we jump back over to the platform and uncheck our Strangle and check on our Straddle, what you’ll notice is that our breakeven points are much closer to where the current price is.
If we drag our price slices to those breakeven points, the platform will automatically give us our probability of making money on the trade if we hold it all the way to expiration.
It’s a lower probability trade than the Strangle, but our max potential profit is much higher. That’s one of the reasons why we close these trades earlier.

We’re not waiting for the full 40-50% of max profit. We’re going to close this with about 25% of max profit. We’ll book those gains and then redeploy that capital into other high probability trades.
The only difference between a Strangle and a Straddle, is how wide you want to be away from price. A Strangle is going to be a little bit wider, but your max profit isn’t going to be as high. Whereas the Straddle is going to be more narrow, but your potential profit is higher.
#3 Butterfly Spreads
Going back to the eBook, let’s look at income strategy number three. We’re going to look at the Butterfly Spread.
A Butterfly Spread is similar to a Straddle, except we’re actually defining the risk. Our downside risk is defined. We know exactly what our risk is at order entry, as well as our upside risk.
We’re still putting these on in a market neutral assumption, when implied volatility is high, still entering with 30-60 days to expiration.
We’re taking a profit target a little bit earlier, but fairly similar to a Straddle, kind of in that 15-25% range. We typically have a probability of profit between 35-50%.
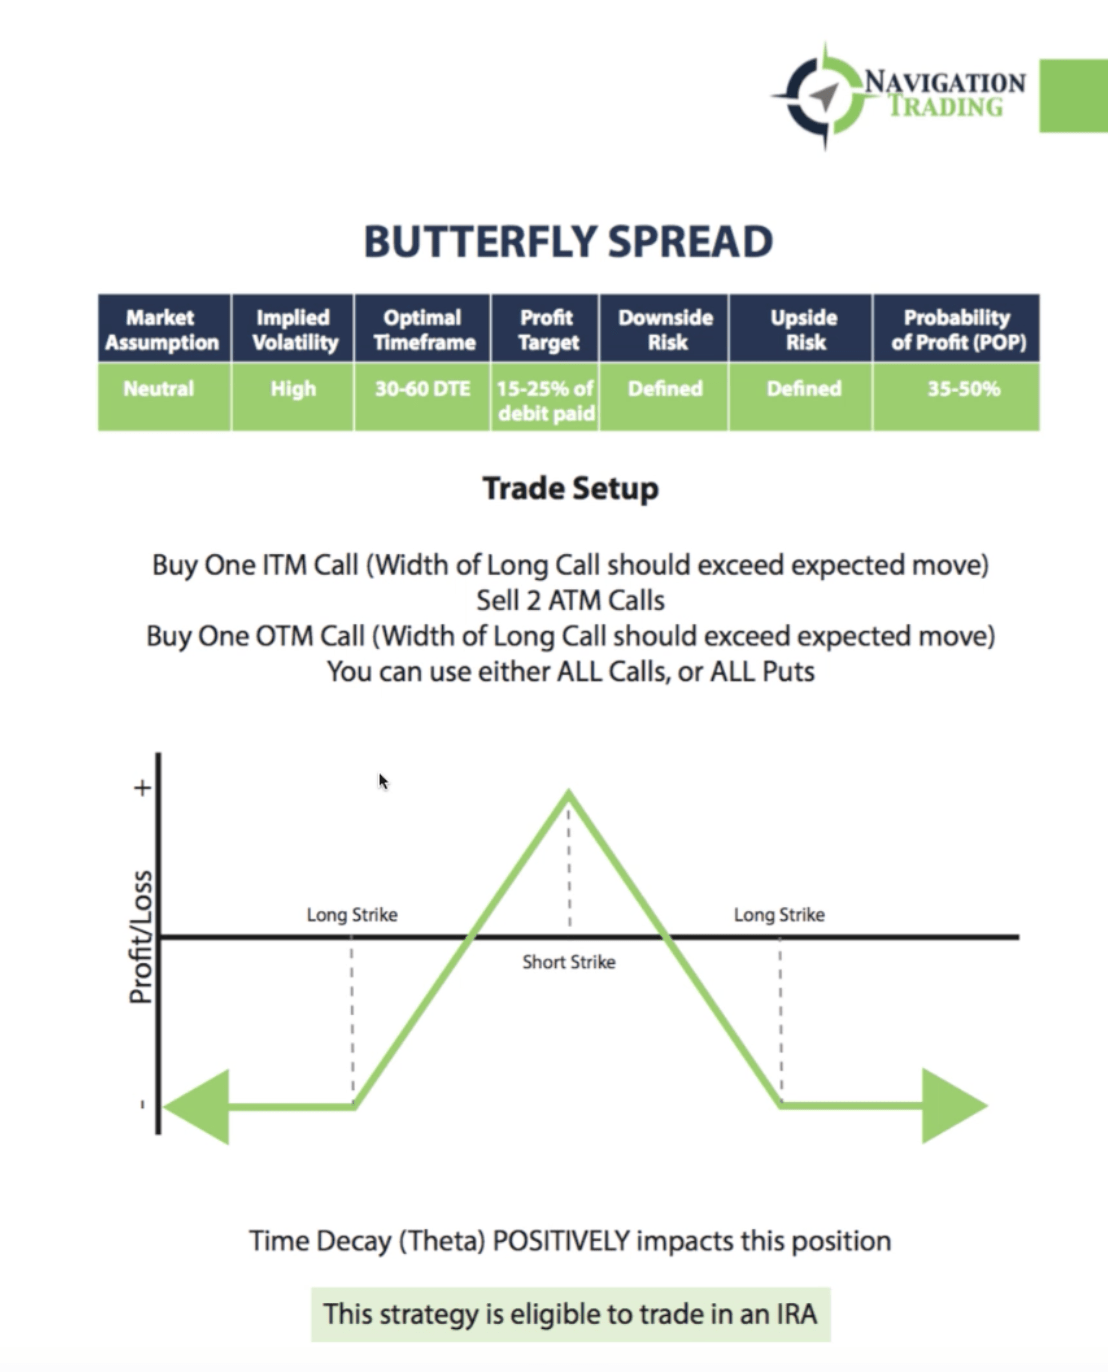

To enter a Butterfly Spread, you are buying one in the money call (the width of the long call should exceed the expected move). We’re going to sell two at the money calls.
Then, we buy one out of the money call (the width of the long call should exceed the expected move). You can use all calls or all puts.
Time decay positively impacts this position.
The Butterfly strategy is eligible to trade in an IRA. You can trade a Butterfly in a margin account or in an IRA.
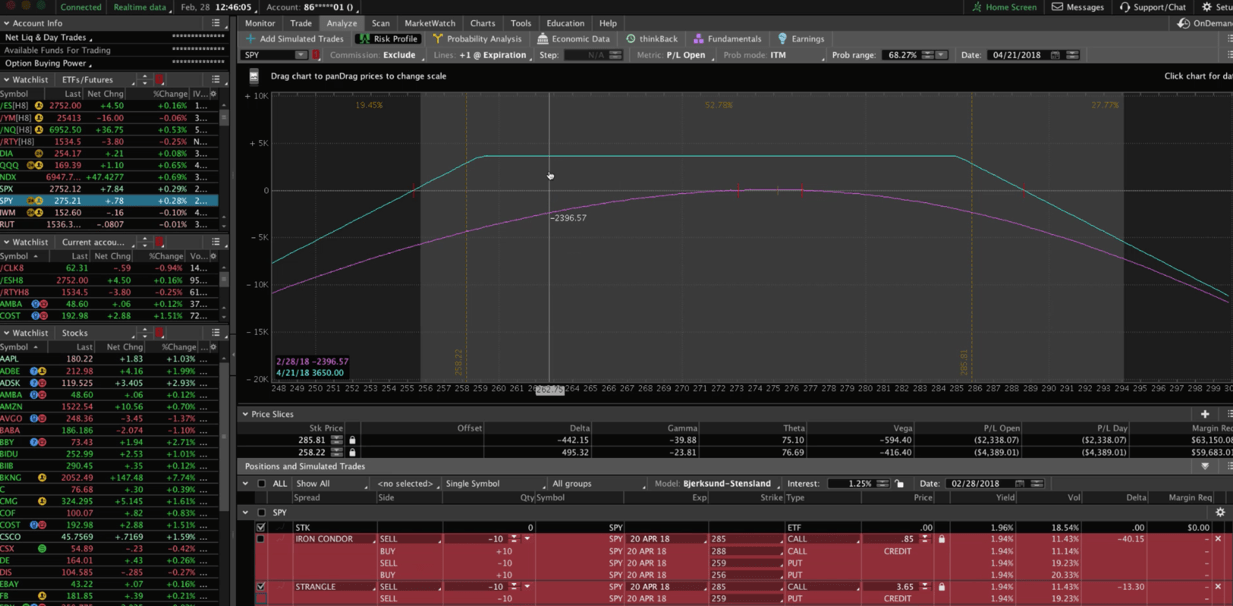
Let’s go back to the platform so I can explain a bit better. If we click on our Butterfly, what you’ll see is that our probability of profit gets a little bit tighter. We are narrowing our range.
Our probability of profit between now and expiration is a little bit lower than a Straddle. However, it’s a very similar graph, with the wings that we’re buying defining our risk. We know that if the market crashes, the most we can lose is what we enter the trade with.

We’re doing 10 contracts here. We’re looking at $11,200 as far as our max loss. Again, we’re looking to be in this trade for a short period of time, capture some profit, and then book those profits and redeploy that capital into another high probability trade.
#4 Iron Condors
Going back to the eBook, let’s take a look at income strategy number four, the Iron Condor.
A lot of newer traders begin with Iron Condors, because you can get wide away from price. You can build a nice wide range to profit in, but you’re also defining your risk.
Just like the others, our market assumption is neutral. We want price to stay in a specific range. We want to enter when implied volatility is high, between 30-60 days to expiration. We’re profiting a target of max profit of 30-50%.
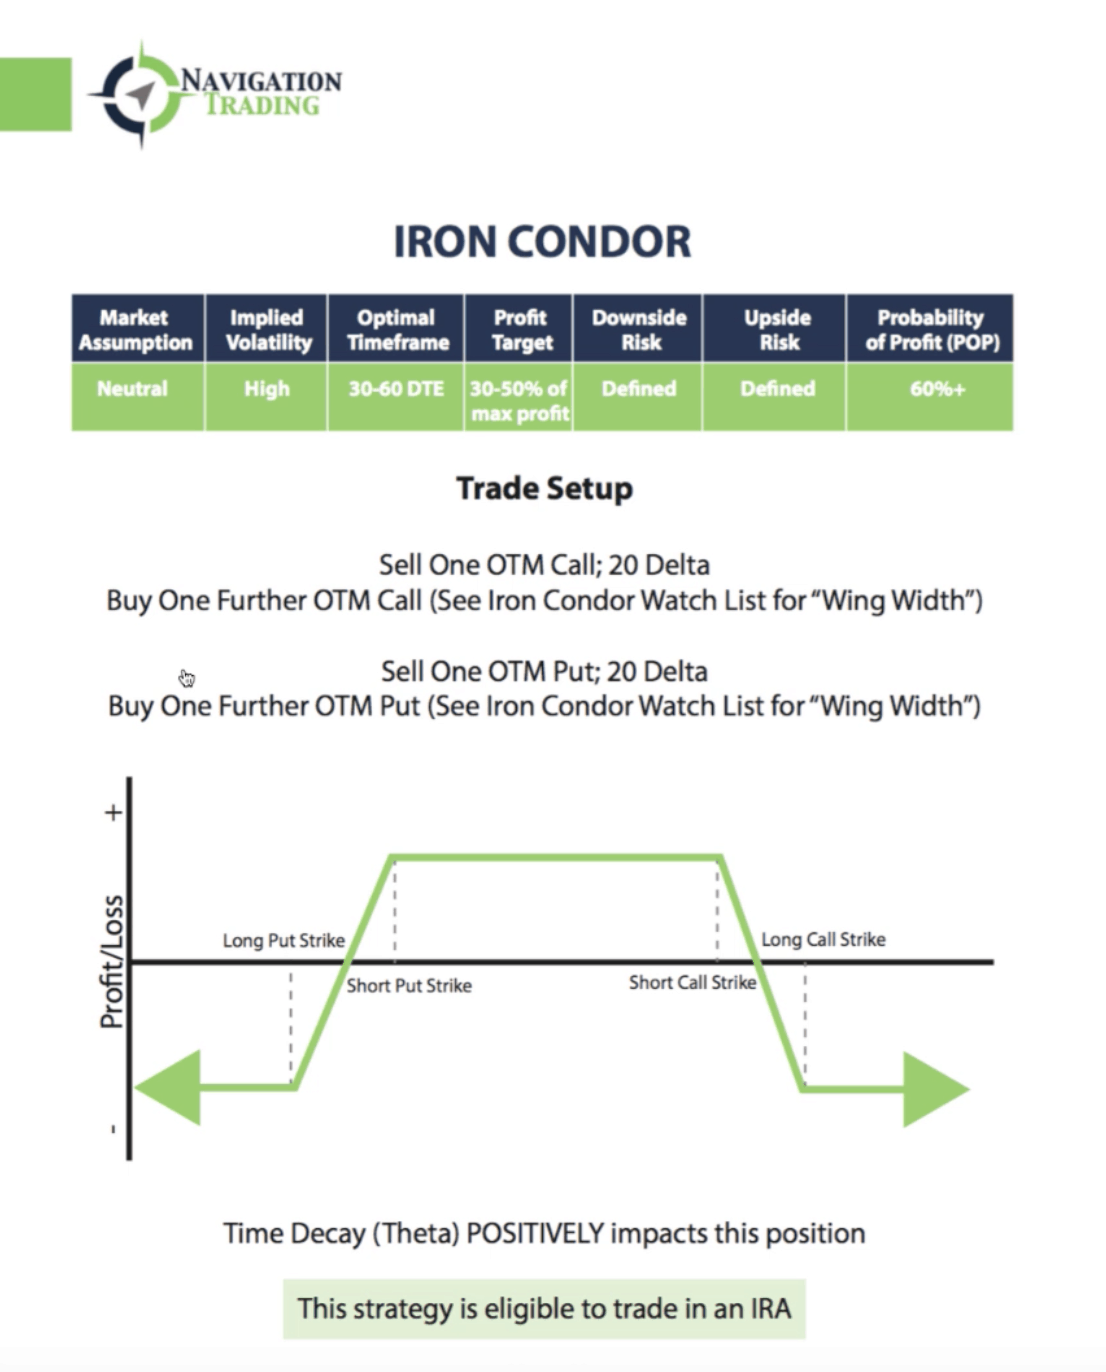

Our downside, as well as our upside risk is defined. We’ll know exactly what our risk is before we even enter the trade.
We’re going to sell one out of the money call, around the 20 delta. Then, we’re going to buy one further out of the money call.
The width is based on the specific symbol you’re trading.
Same thing on the put side. We’re going to sell an out of the money put. We like to do it around the 20 delta, and buy one further out of the money put, with the width, depending on the symbol that you’re trading.
You can see what Iron Condors look like from the graph depicted above.
Again, time decay is positive. This strategy can be traded in an IRA or a margin account.
Let’s jump back over to the platform and take a look at an Iron Condor. If we click on the Iron Condor, you can see we’ll need to reset our slices to the breakeven point, to get that probability of profit.
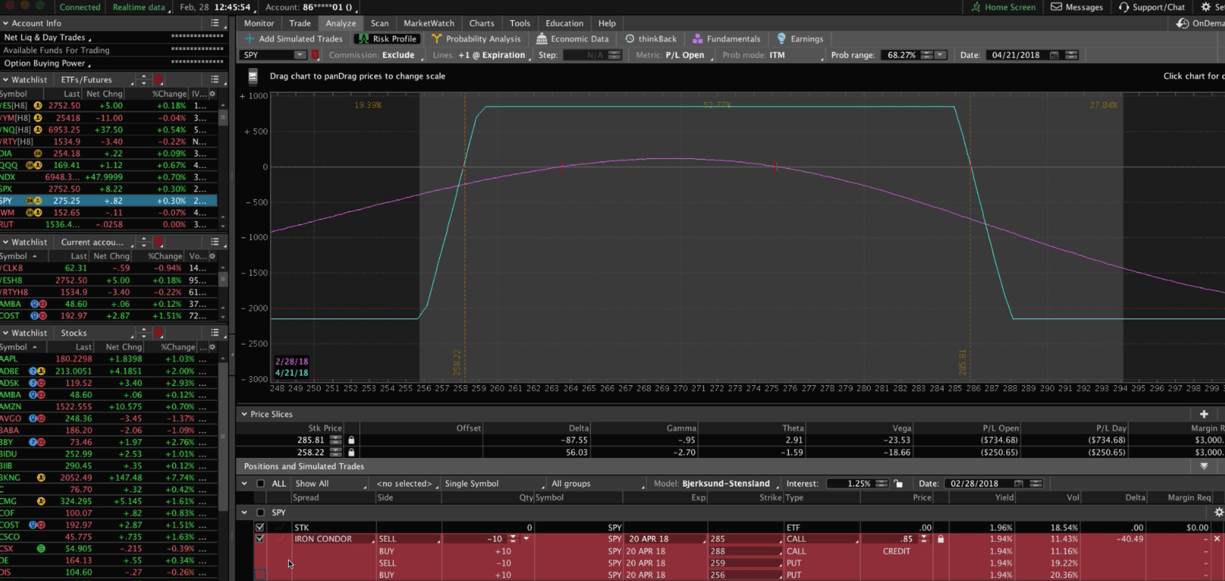

You can think of an Iron Condor as a Strangle, but with defined risk. I’m going to click back on the Strangle, to give you an idea. You’ve got the same long, flat, max potential profit range.

The difference is, with an Iron Condor, because we are defining that risk, our probabilities are going to be a little bit lower than a Strangle. Our probability of profit is not quite as high. Our max potential profit is going to be much lower as well.
In return for lower probability of profit and max potential profit, you have defined risk. You can see where it flat lines here all the way to the upside, no matter how high the stock goes. The same thing on the downside. If the market were to crash, that’s the maximum that you can lose.

There are positives and negatives to both Iron Condors and Short Strangles. If you’re okay taking that undefined risk, then the Short Strangle might be the best strategy for you. If you want that defined risk, if that’s the most important thing to you, then an Iron Condor can be a great strategy as well.
There’s no right or wrong answer. It just depends on your risk tolerance and your account size, to decide on which strategy to choose for your account. All four of these strategies that we’ve covered so far, the Iron Condor, the Strangle, the Straddle, and the Butterfly are all trades that we want to put on in periods of high implied volatility.
What do I mean by implied volatility? If we go to the Charts tab, what you’ll see down at the bottom of the screen, is our NavigationTrading Implied Volatility Indicator. You can get this at no cost by logging into your free membership at navigationtrading.com. You’ll be able to copy and paste the script directly into thinkorswim and then our indicator will show up on your chart, just like in the example below. When we say that implied volatility is high, that just means that we want it to be above the 50 level mark.
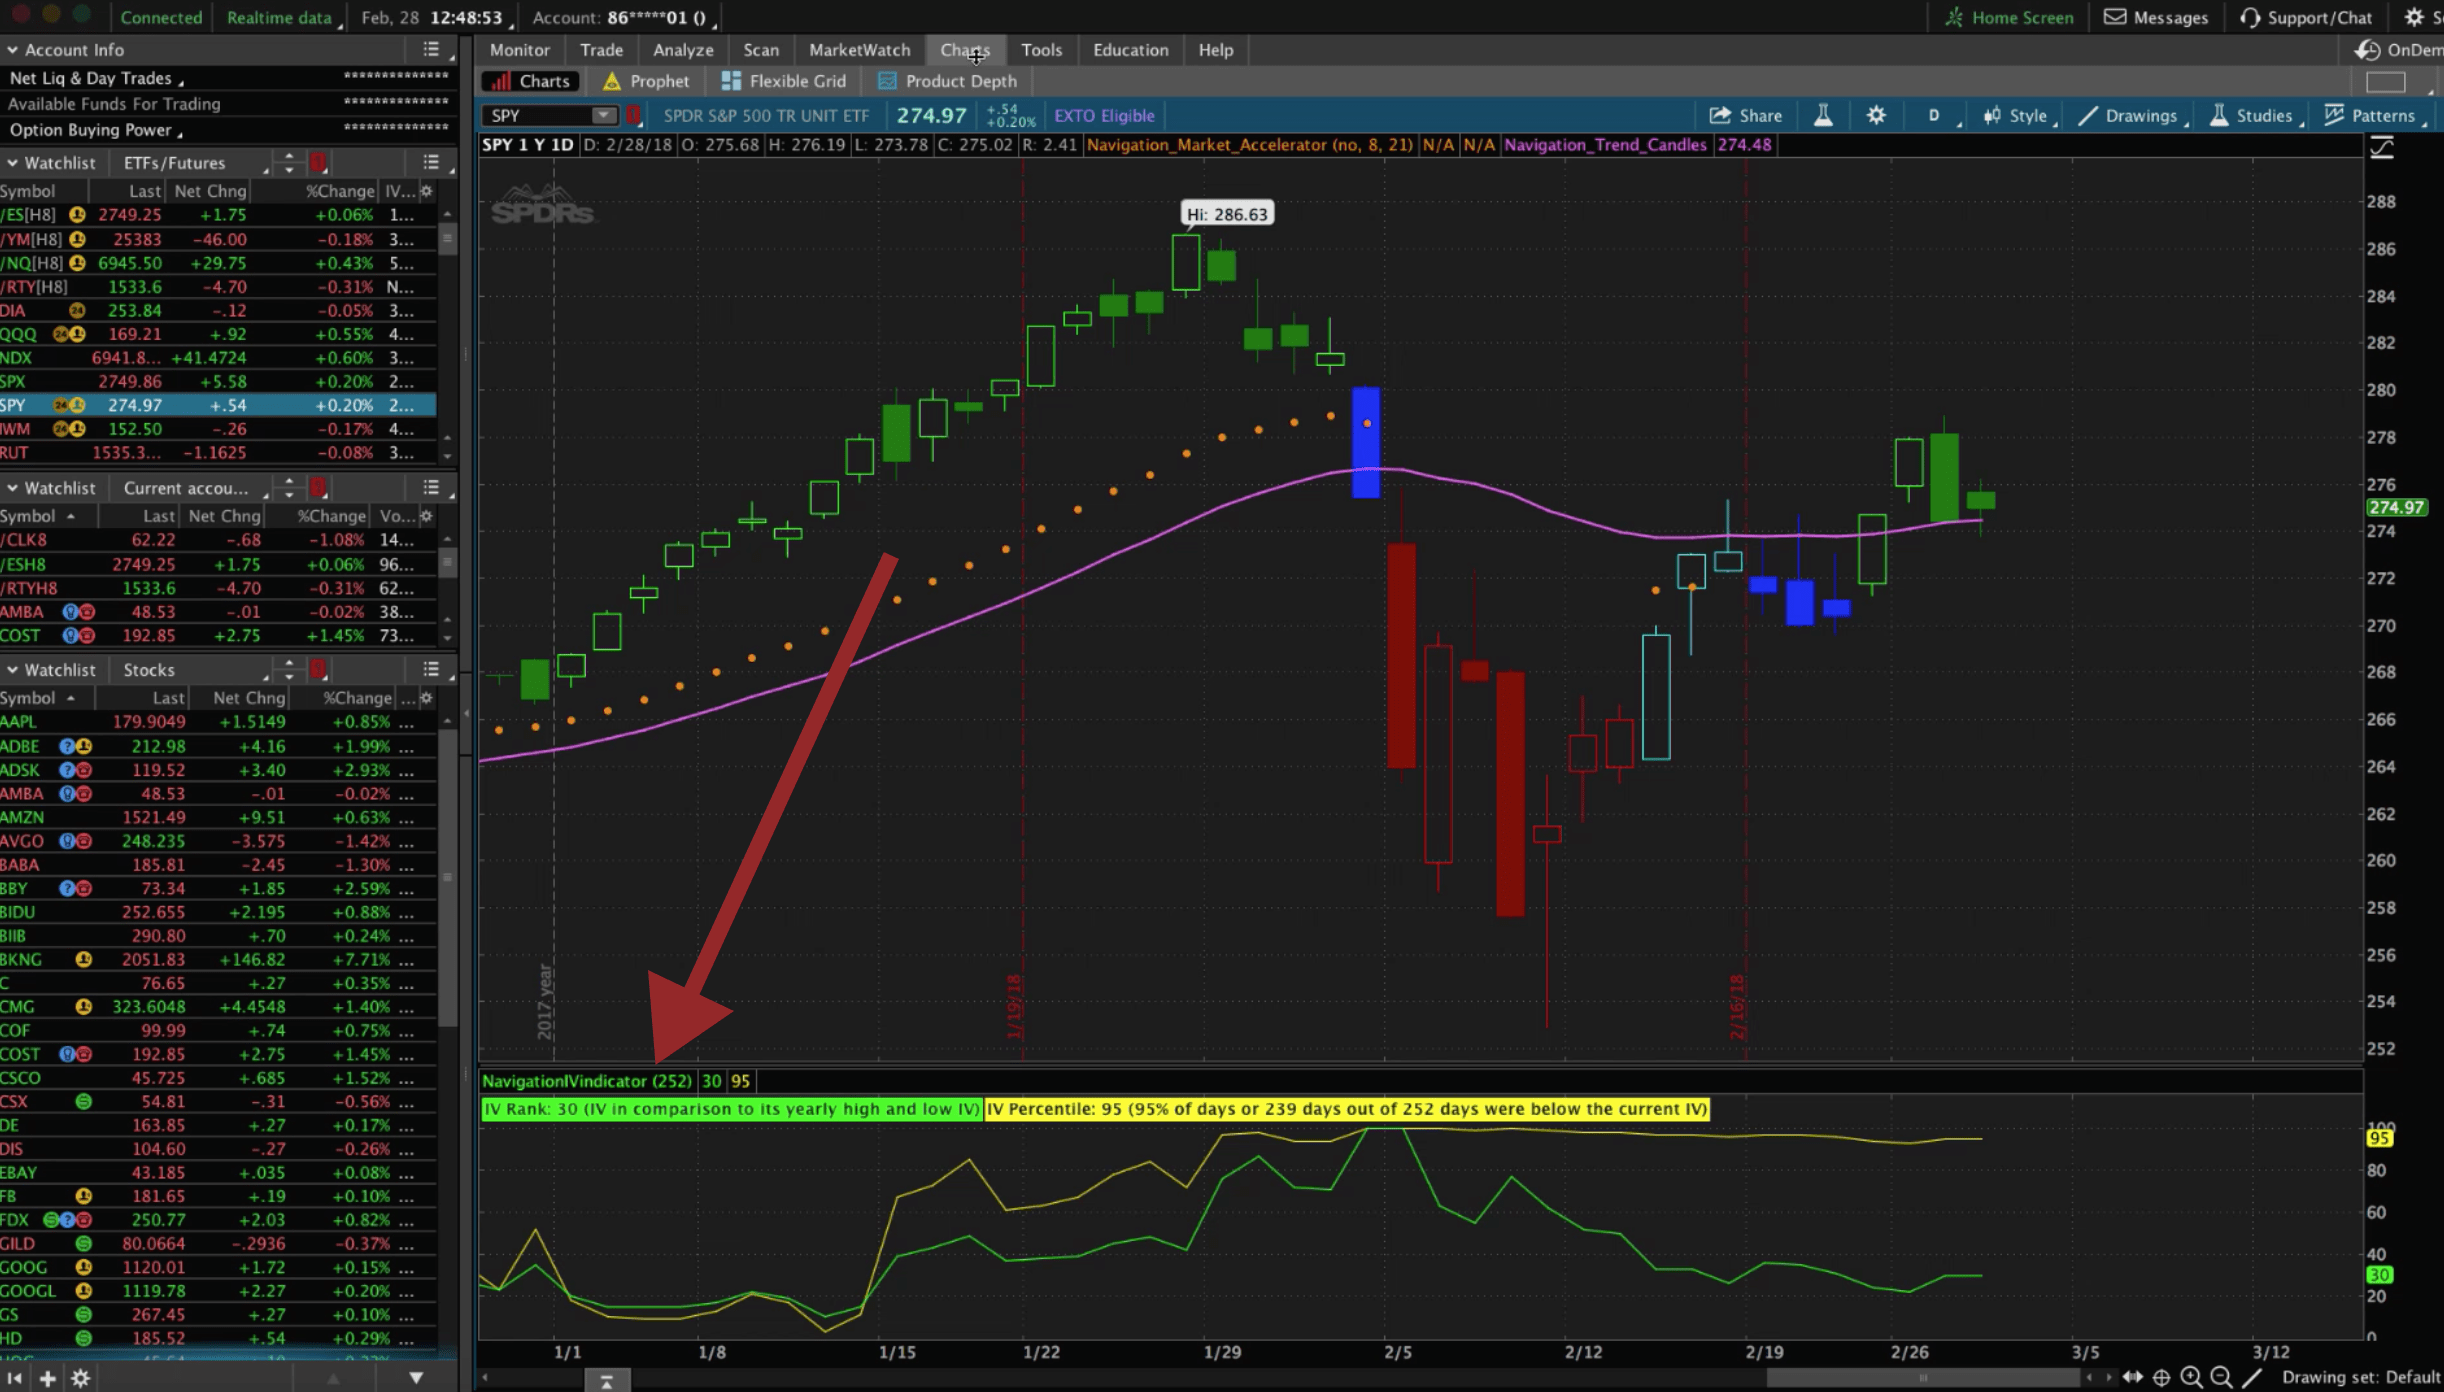

You can see there’s two different types of implied volatility tracking in our indicator. We’re looking at the IV Rank, which is the implied volatility in comparison to its yearly high and low.
Then, we have what we call the IV Percentile. This is where the percent of days, out of the last 252 trading days, were below the current implied volatility.
As long as one of these lines is above 50, we consider that high implied volatility. That’s when we know the pricing of the options is elevated and gives us the ability to put on these Iron Condors, Strangles, Straddles, and Butterflies.
What if implied volatility is low? What kind of strategy can we use? That’s where the Calendar Spread comes in.
#5 Calendar Spreads
Going back to the eBook, let’s reference the Calendar Spread. Our market assumption is neutral, but this where we want to enter these trades when applied volatility is low. We’re looking for a profit target of 15-25% of the debit paid. Similar to a Butterfly, or an Iron Condor, our downside risk is defined as well as our upside risk.
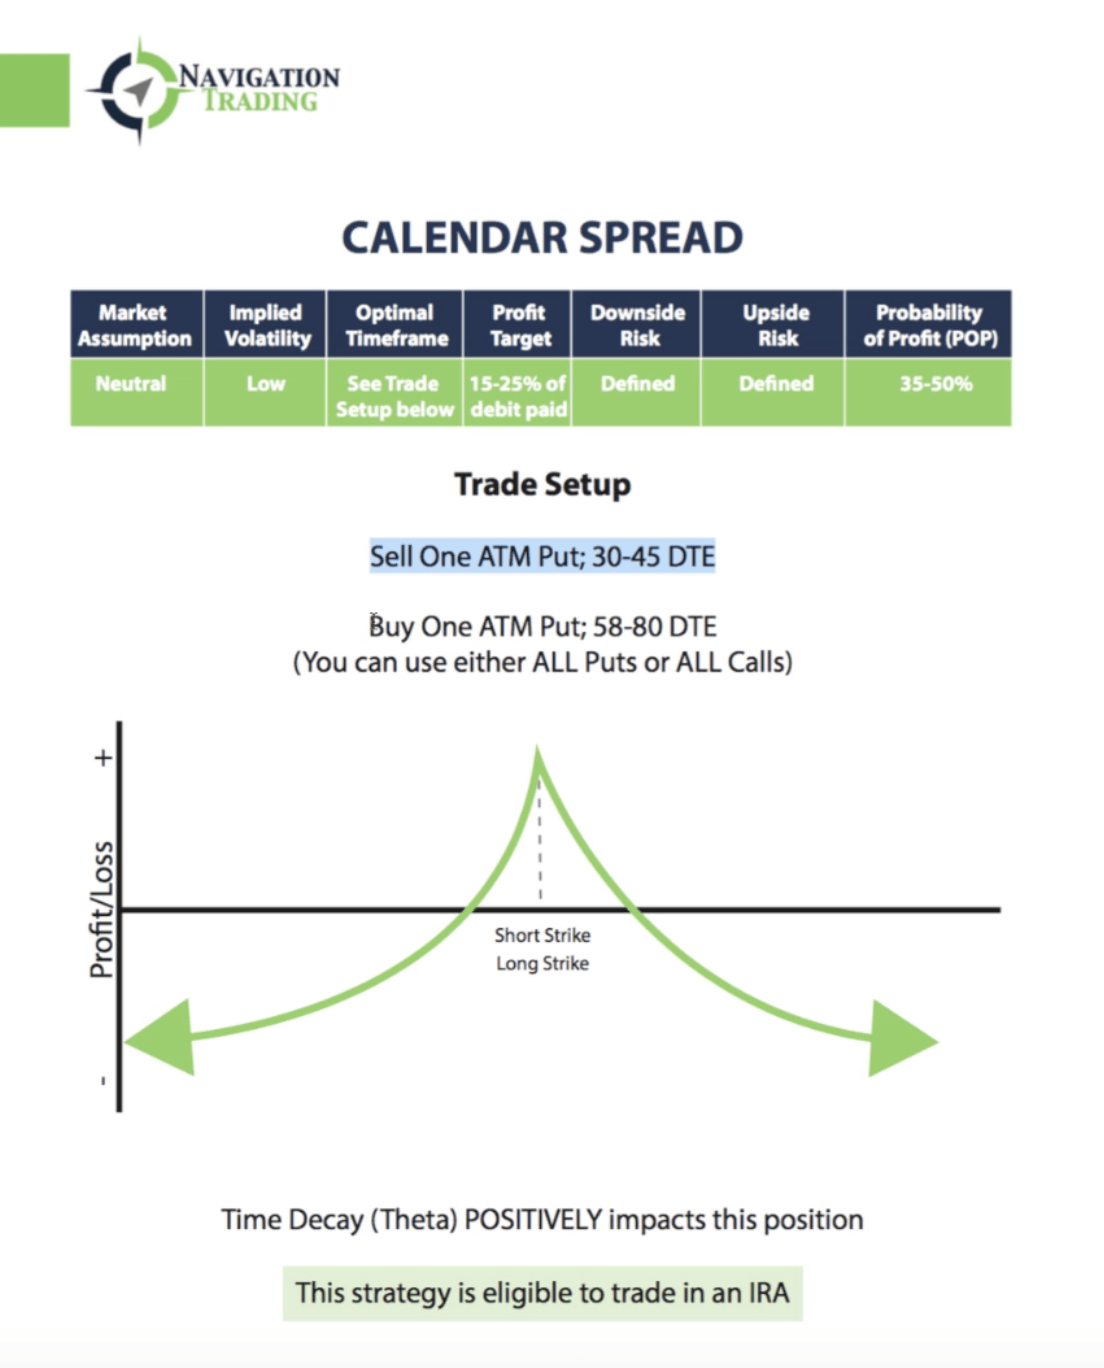

To enter a Calendar Spread, you’re going to sell one at the money put, in that 30-45 days left to expiration. You’re going to buy one at the money put in a further out expiration cycle, in that 58-80 days left to expiration. Like the other strategies, time decay is positive, and the strategy is eligible to trade in an IRA. You can trade it in an IRA or a margin account.
Let’s go back to the platform and take a look.
If we click on the Calendar, here’s what that looks like. As you can see, the risk is defined, so you can’t lose any more than what you put it on for. We’re looking at 10 contracts. Our max loss is $1,003.90. Obviously, if we kick this down to one contract, on any of these, it’s going to be a 10th of what we’re looking at here. Your max risk would be $139 with just one contract.
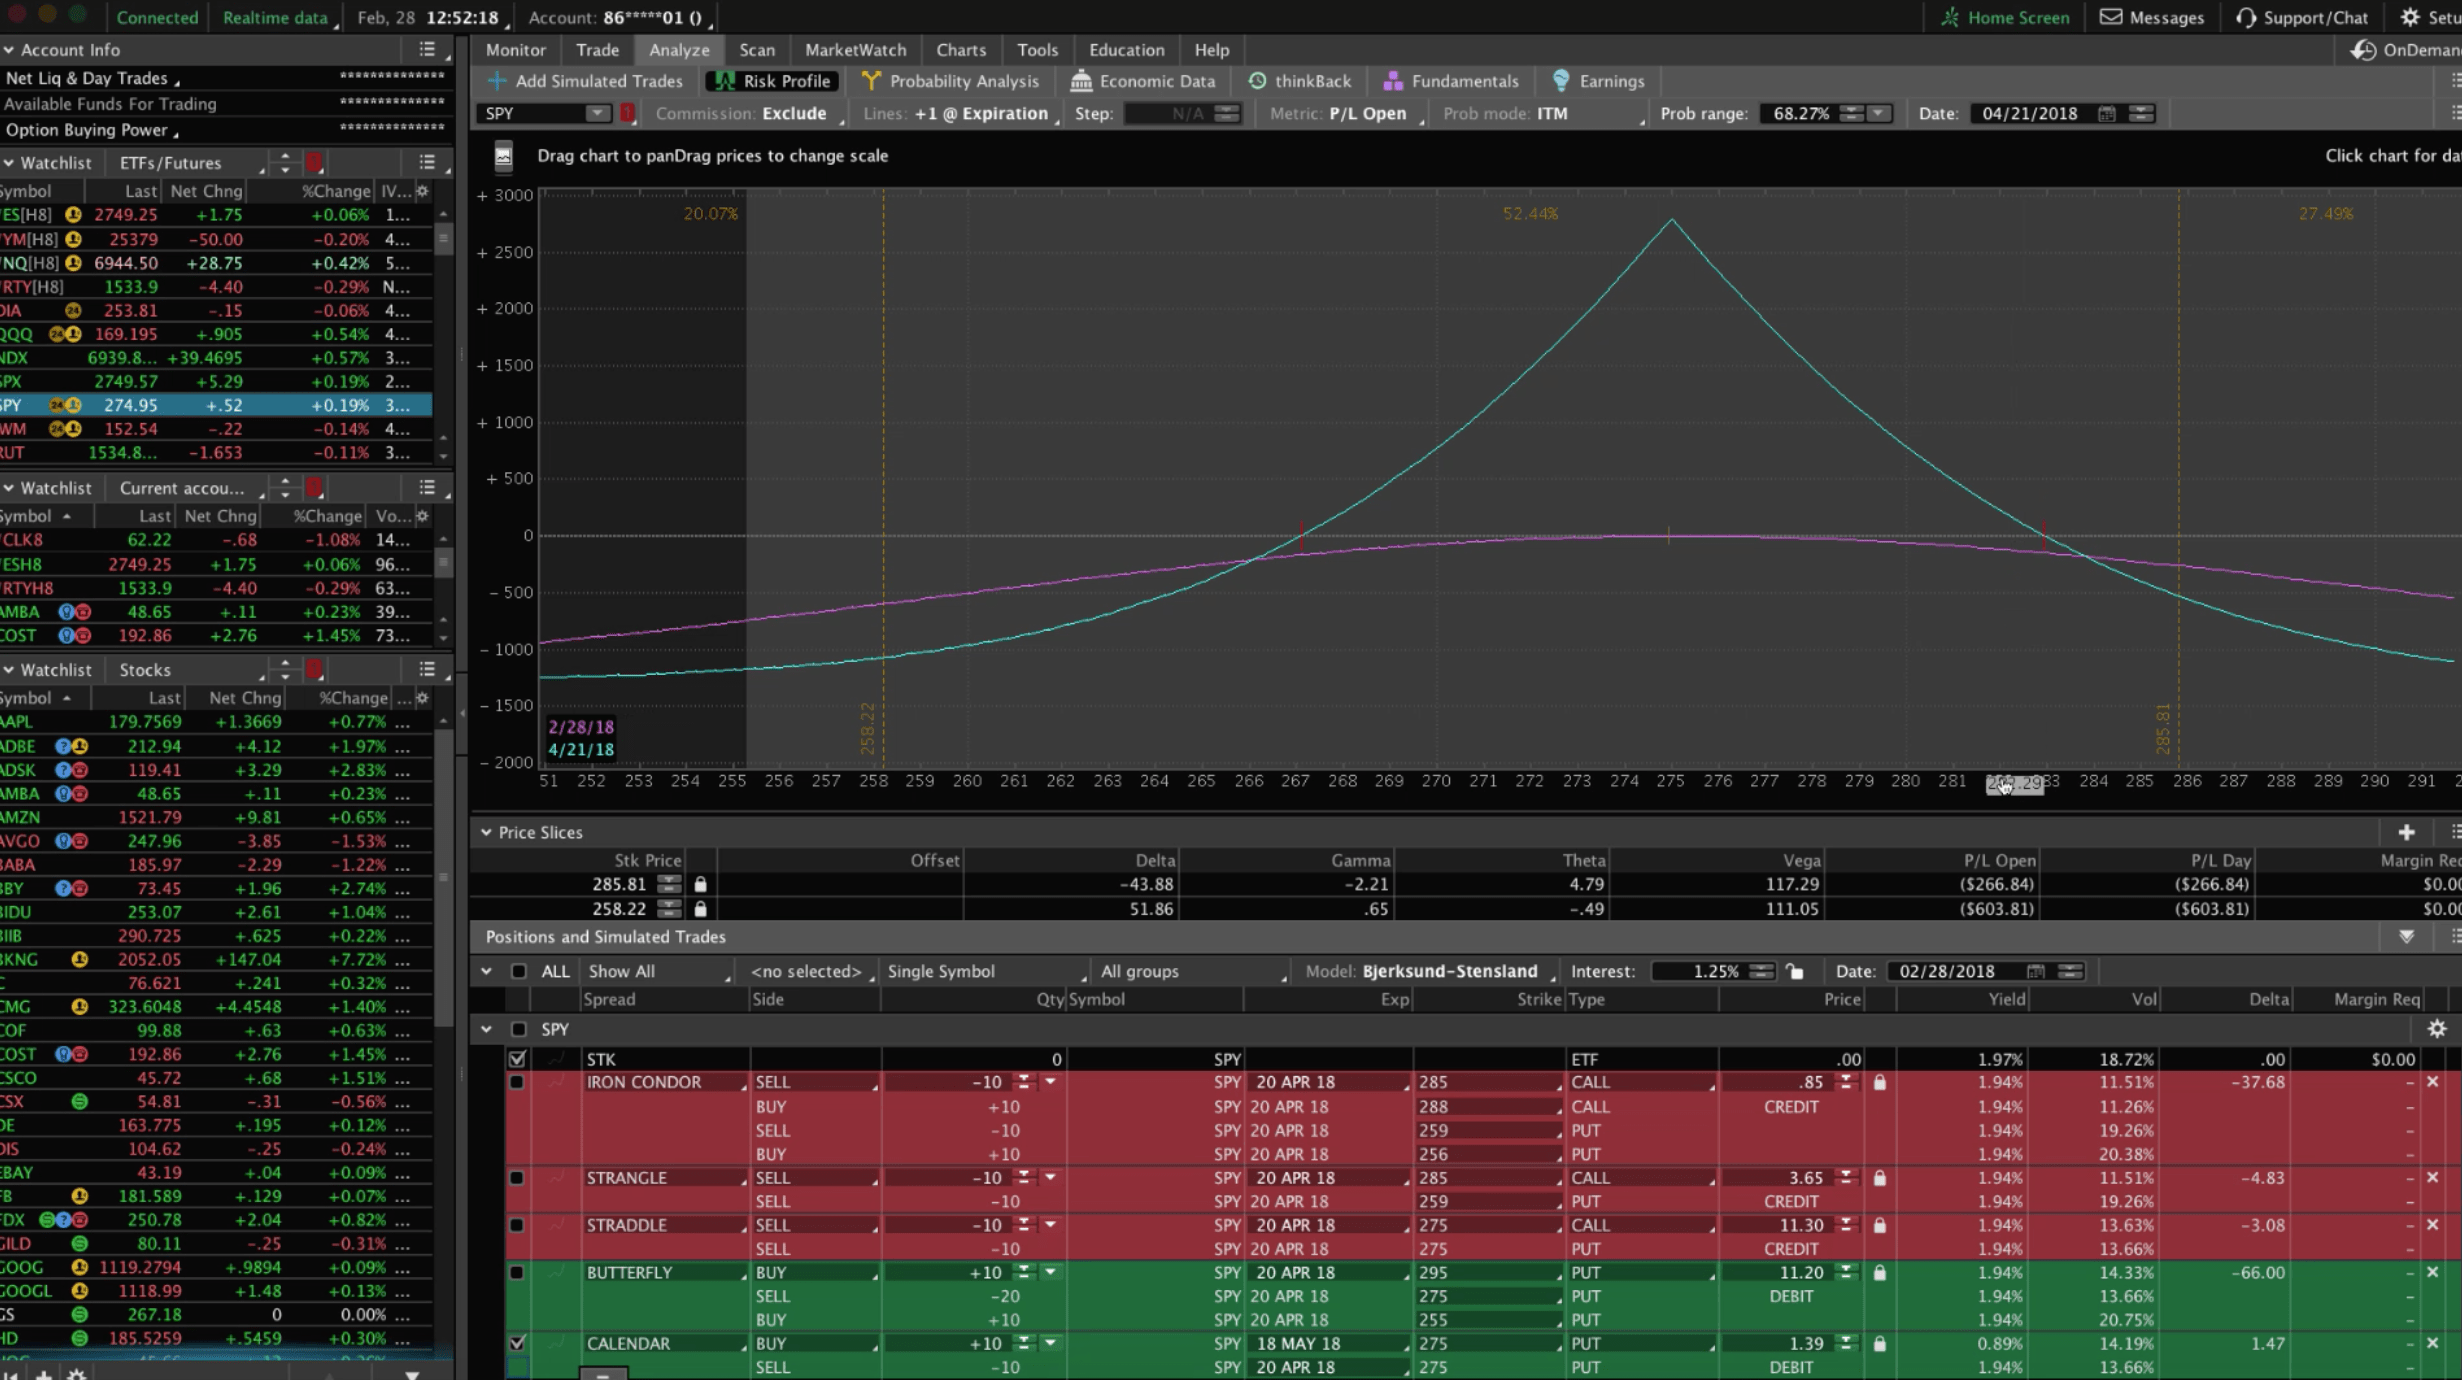

You can do Calendar Spreads in any size account. Then, we can set our probability of profit. Our range is not very wide, similar to a Straddle or a Butterfly Spread. We want to manage these profits early, and get out at a percentage of max profit. We stay in that 15-25% range, and then redeploy that capital into other high probability strategies.
Those are the top five income strategies that we use to generate consistent income. If you’d like access to our eBook, The Trade Hacker’s Ultimate Playbook, where it lists all 19 strategies, just click https://navigationtrading.com/trade-hacks and you’ll get immediate access.
I hope this was helpful!
Happy Trading!

Follow