Welcome NavigationTraders!
In this lesson, we’re going to discuss Long Put Verticals.
Long Put Vertical Specs
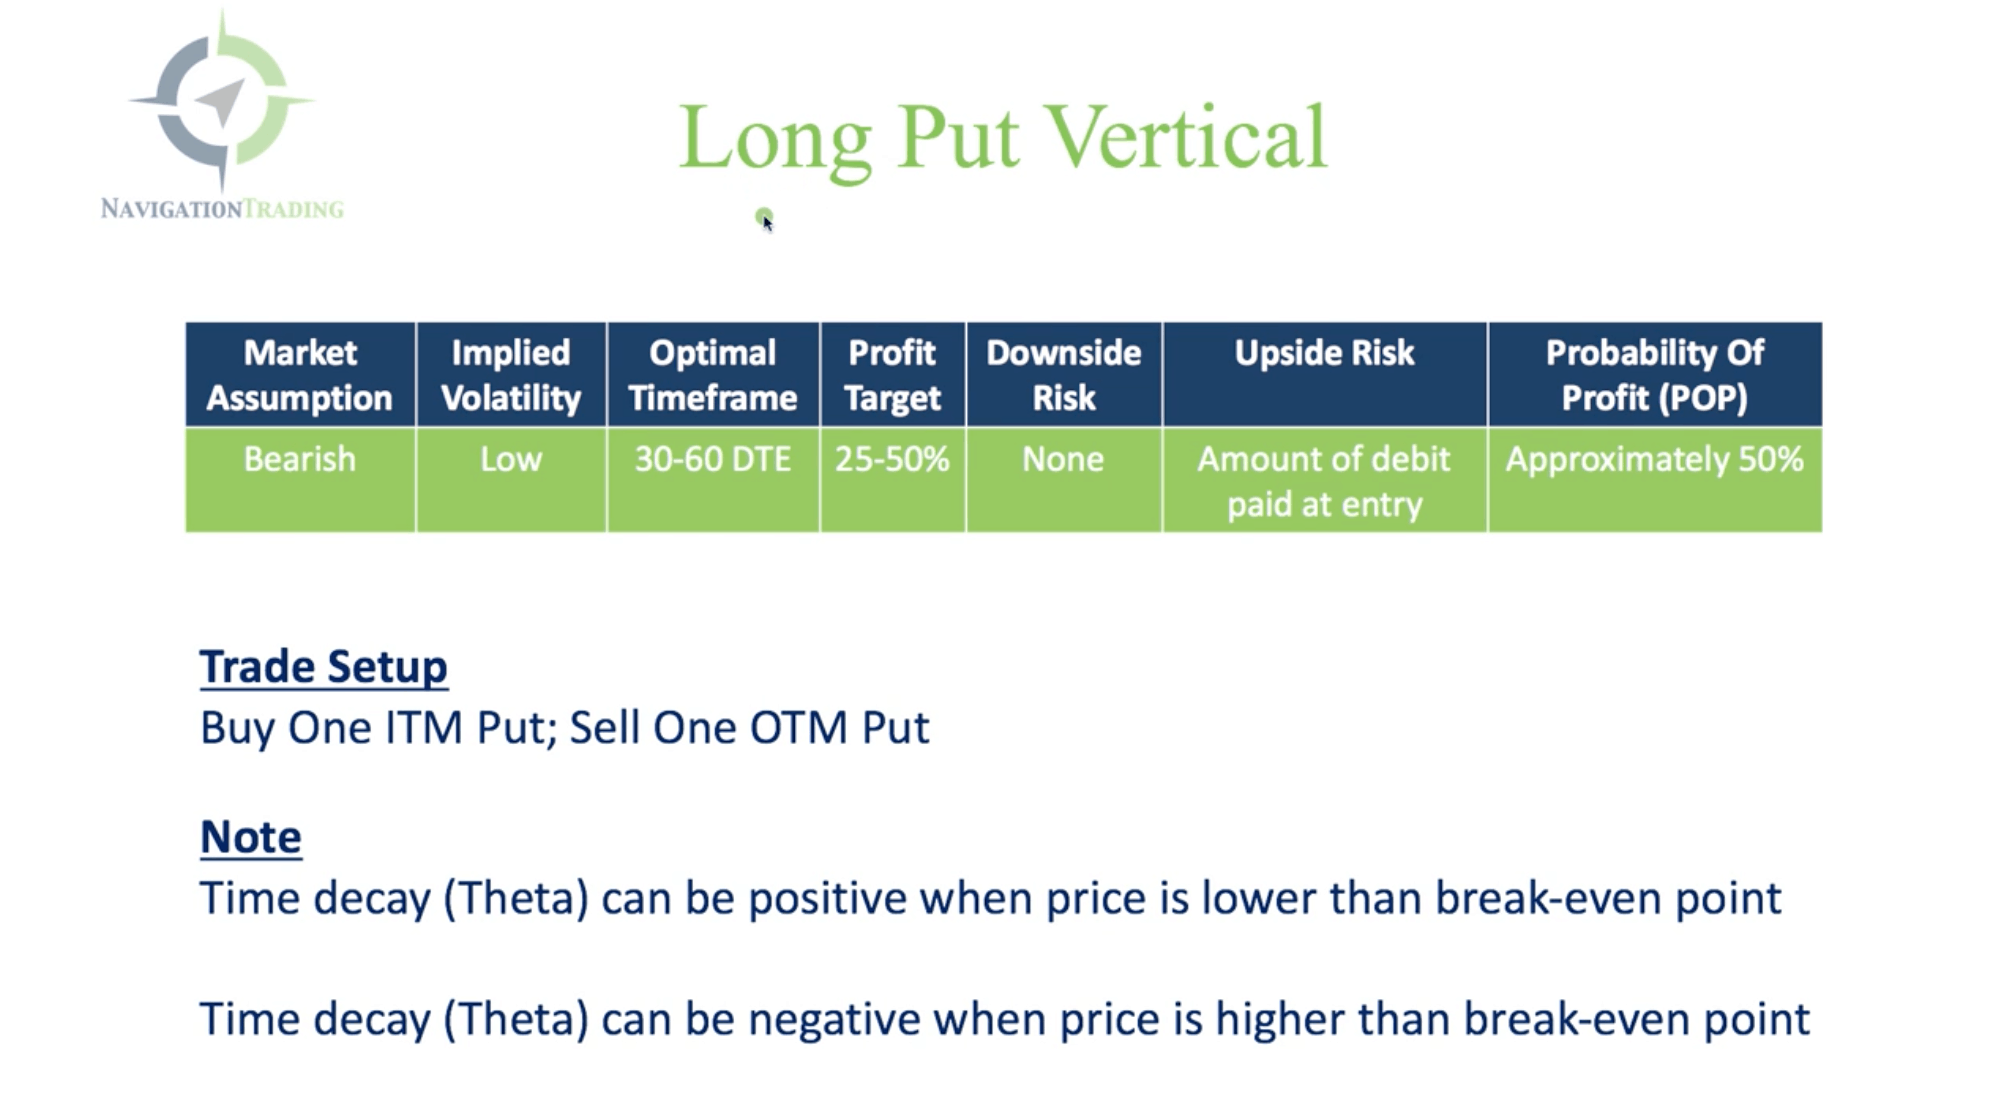
The market assumption when you put on this trade is bearish. Meaning, you anticipate, or want the underlying security or symbol to go down.
The implied volatility should be low when you use this strategy because an expansion in implied volatility will help this position.
Your optimal timeframe is 30-60 days left to expiration. That’s the sweet spot for entry.
The profit target is a bit subjective. It’s a range, in that 25-50% of debit paid. That’s what we want to look for as a profit target.
The downside risk in this trade is none. Obviously, you profit if the price goes down, so the risk is not to the downside.
The upside risk is defined, so it’s limited to the amount of debit that you pay when you enter the trade.
The probability of profit, with the way we set this up is approximately 50%. This is essentially a 50/50 bet. This is really a short stock replacement. You think of that as a 50/50 probability of profit because you don’t necessarily have any extra probabilities on your side. You’re just making an assumption, you’re making a directional trade, and your probability’s about 50/50.
For the trade setup, we’re going to buy one in-the-money Put, and we’re going to sell one out-of-the-money Put. This is all done with one click from your platform (we are using thinkorswim), but the setup is actually buying one in-the-money Put and selling one out-of-the-money Put.
Just to note, time decay or theta, can be positive when price is lower than your break-even point. Time decay can be negative when the price of the underlying symbol is higher than your breakeven point.
Let’s go to the platform and take a look at an example.
Platform Example
When I look to enter these types of trades, I want to look for a symbol or a stock that has had a short-term or long-term price extreme. Essentially, when I’m using this strategy, I’m just playing the role of contrarian. XLV has had a nice move to the upside. In the last 25 days, this stock is up over 8%.
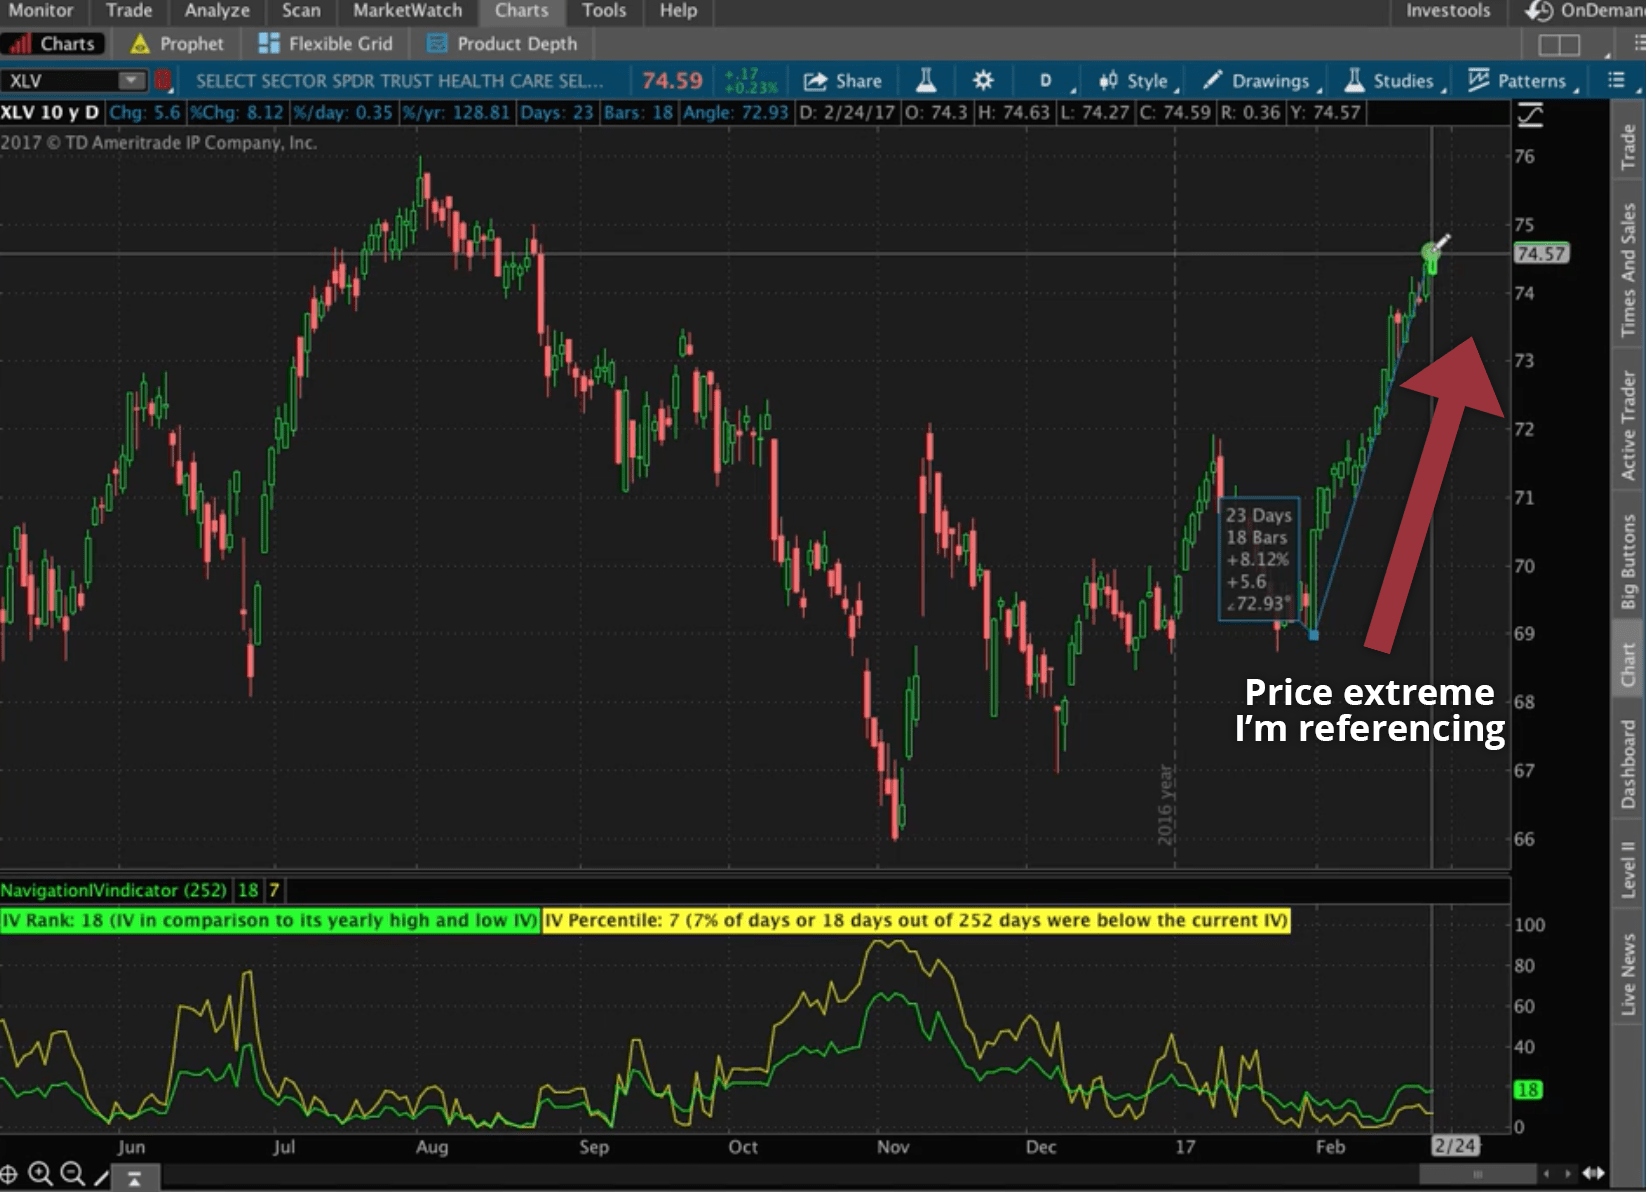
Stocks don’t go up forever. In this case, with XLV, the healthcare ETF, it’s an extremely liquid symbol. I’m just looking to put on a directional trade that says this stock might reverse a little bit in the near future, in the next 30 to 60 days. That’s the assumption.
Choosing Your Option Chain
We’d go to the Trade tab, and look for the option chain in that 30-60 days left to expiration timeframe. I stay out of the weeklies for this type of strategy. The option chain with 56 days left to expiration is the monthly chain that falls in that range, so that’s the one we’re going to use.
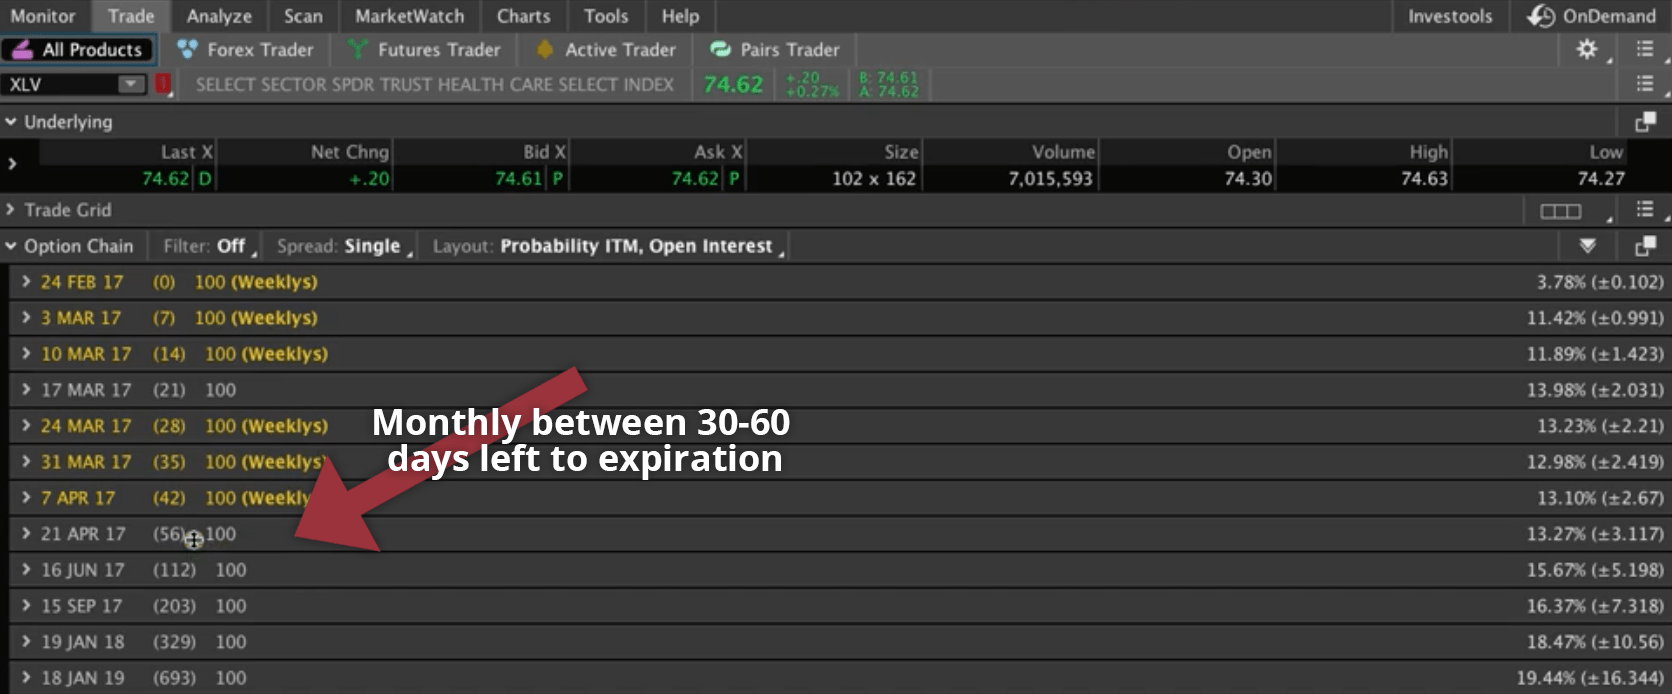
Between now and the next 56 days, I think that XLV is going to trade below where it is right now, and that’s the assumption that I’m making. That doesn’t mean it’s going to happen, but that’s the way that I trade looking for potential price extremes, and looking for a bit of a reversal to profit on that trade.
Choosing Your Strikes
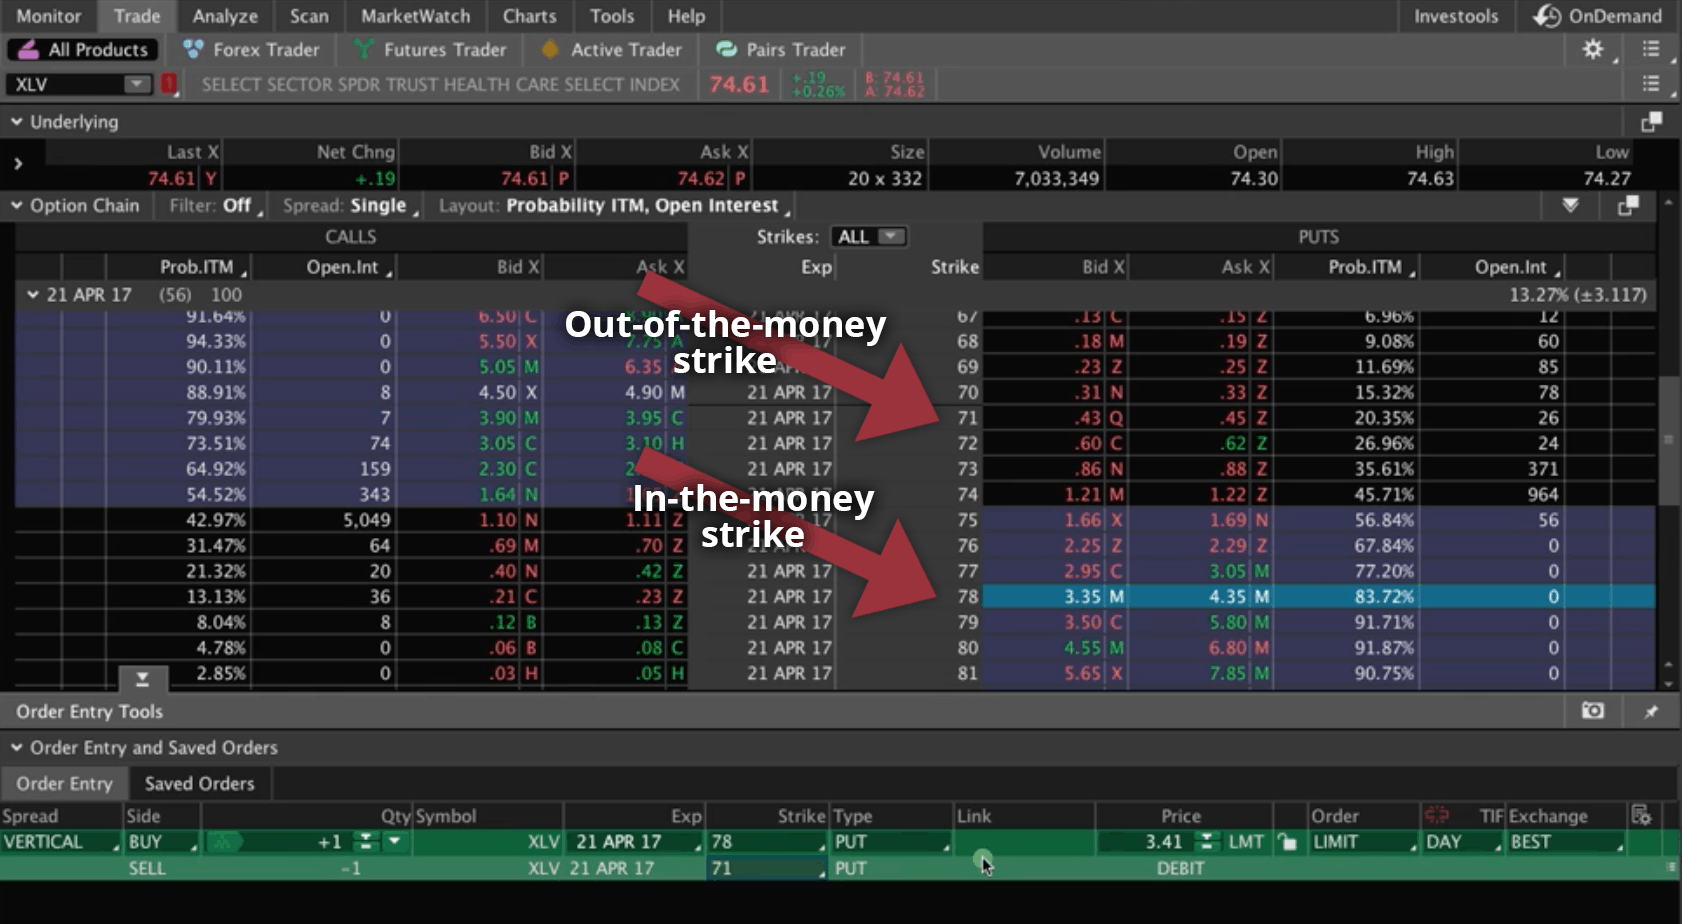
Once you’re in monthly option chain with 56 days remaining to expiration, remember, we’re going to buy an in-the-money Put. The in-the-money Puts are on the purple shaded right-hand side. We want to look for the current price. XLV is currently trading about $74.5.
You can play with how wide you want your strikes to be. Let’s just say, we want to buy the 78 in-the-money strike. We’d right-click, select “BUY”, and then select “Vertical”.
That’s going to populate down below in the Order Entry area. It inputs our 78 that we bought, that’s indicated by a plus sign, and then it automatically goes to the next strike lower. We don’t want that strike. Remember, we’re going to buy one in-the-money Put, and then we’re going to sell a Put that’s out-of-the-money, so outside the shaded area.
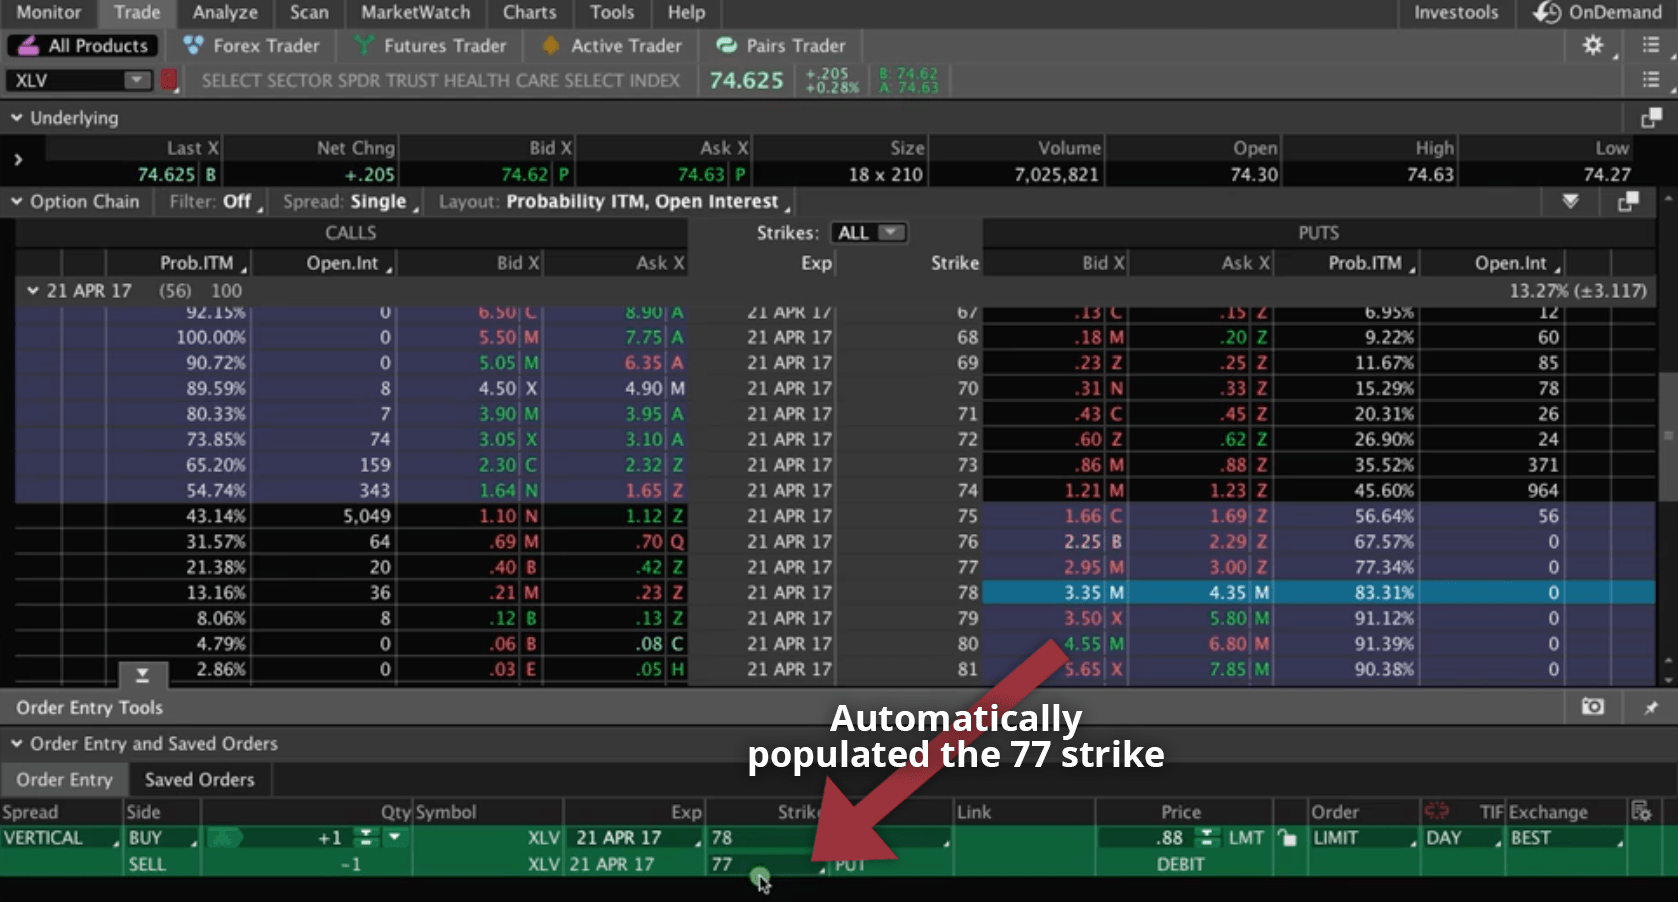
Let’s say, we want to get right around where it’s currently trading. It’s about $74.5. I chose to buy the 78. Let’s sell the 71 for this example because that gives us a similar amount of strikes on either side of where our price is. Then we can analyze the trade.
Analyzing the Trade
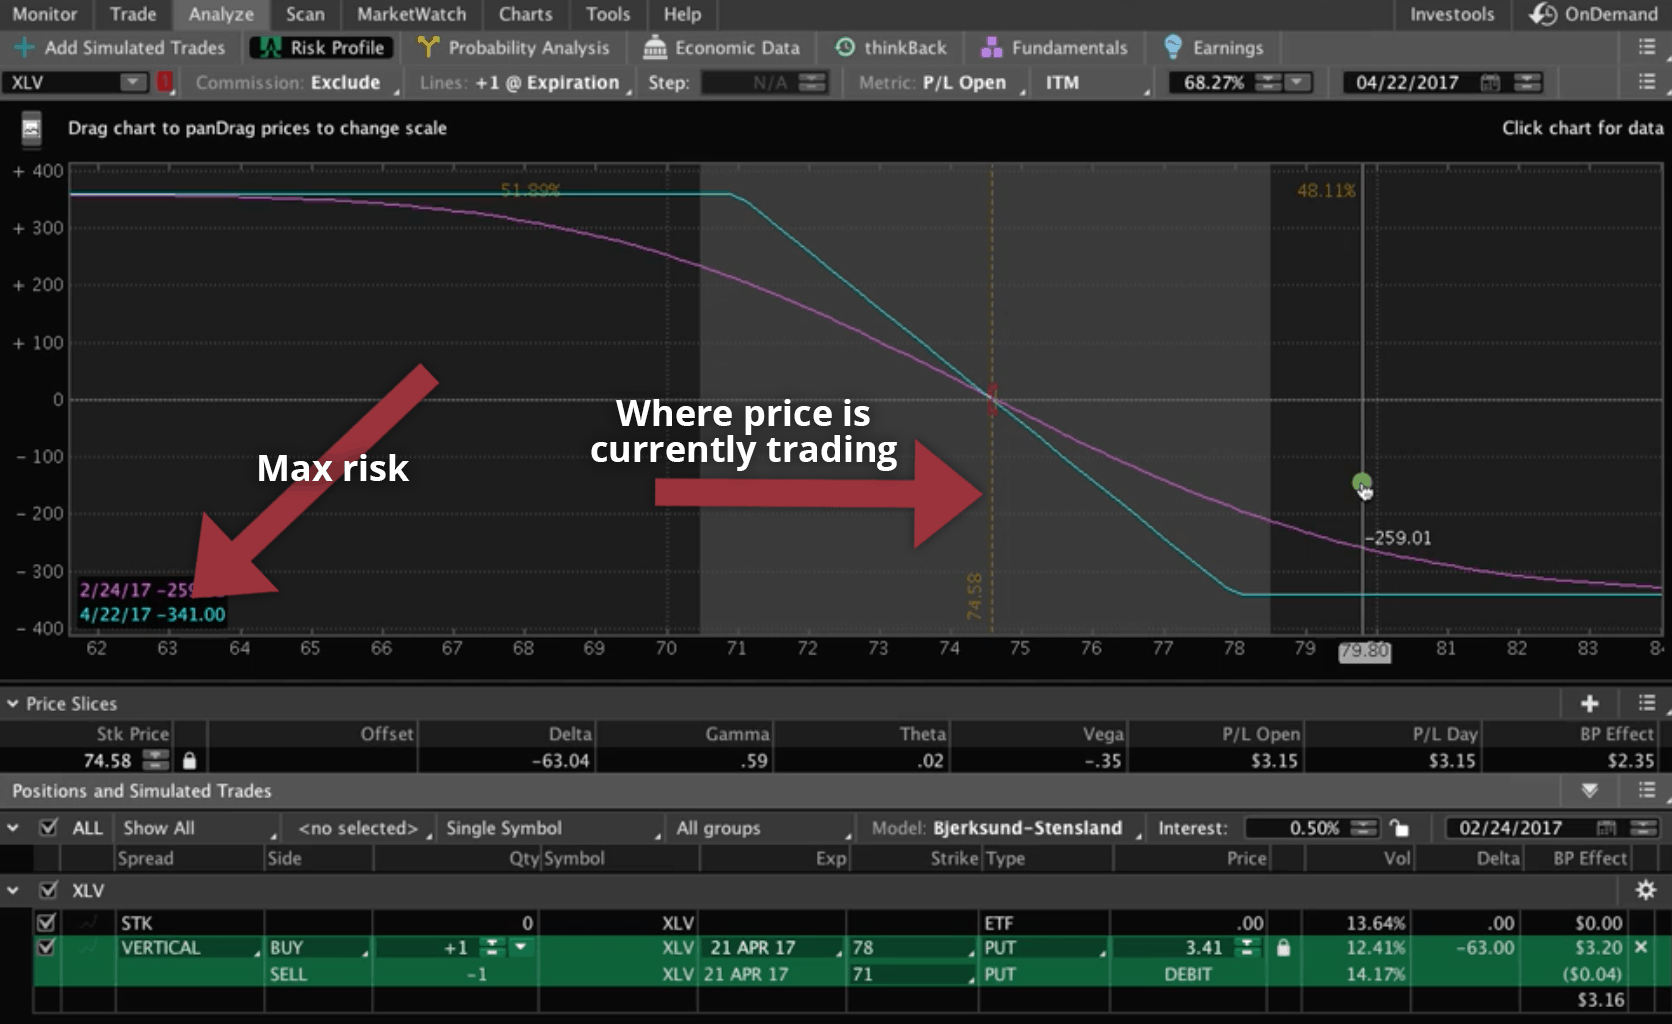
If we right click the order, and select “Analyze trade”, it’s going to populate on our risk profile graph. You can see where price is currently trading. If price were to continue to go to the upside, your max risk on this trade is $341. That’s the debit that we would pay for this trade.
On the downside, risk is defined. We don’t have any risk to the downside, and our max profit is $359.
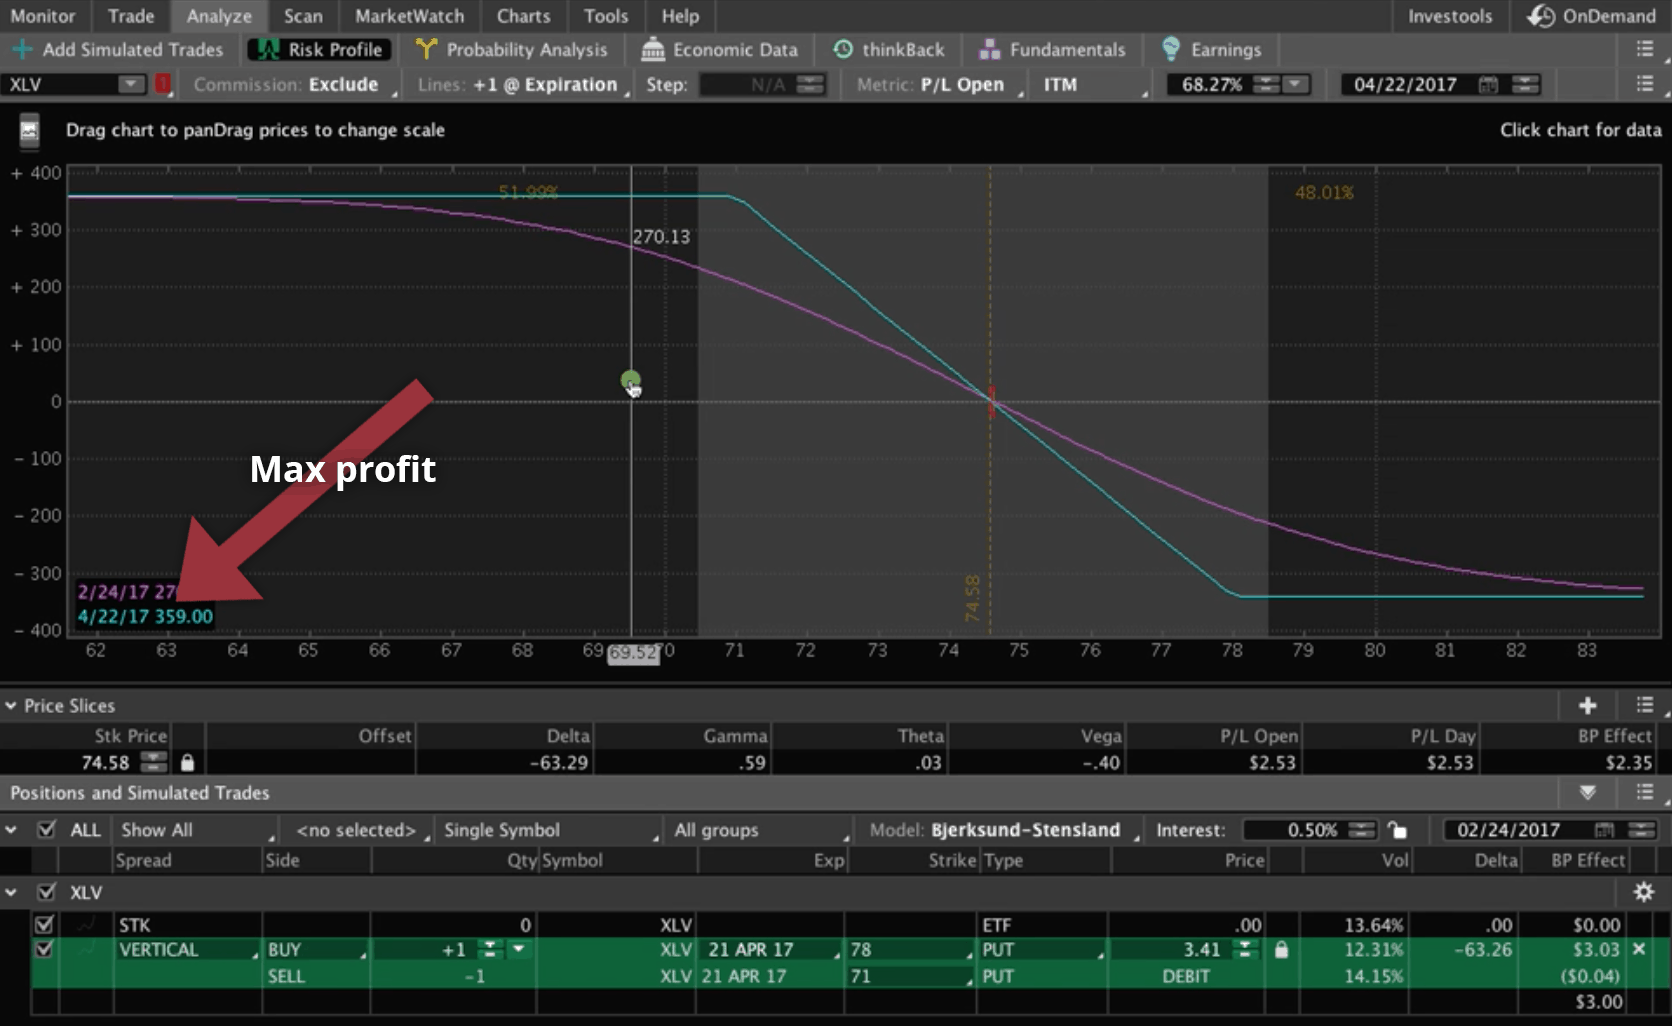
We’re going to manage this trade once we reach around 25-50% of max profit, somewhere between $73 to $72. If the price does move down just a couple of bucks, we can manage this trade for a winner, and then redeploy that capital.
Let’s say we didn’t want to risk $341, we wanted to risk less. We could move our 78 strike in to 77 if we wanted. We could move the 71 up to 72.
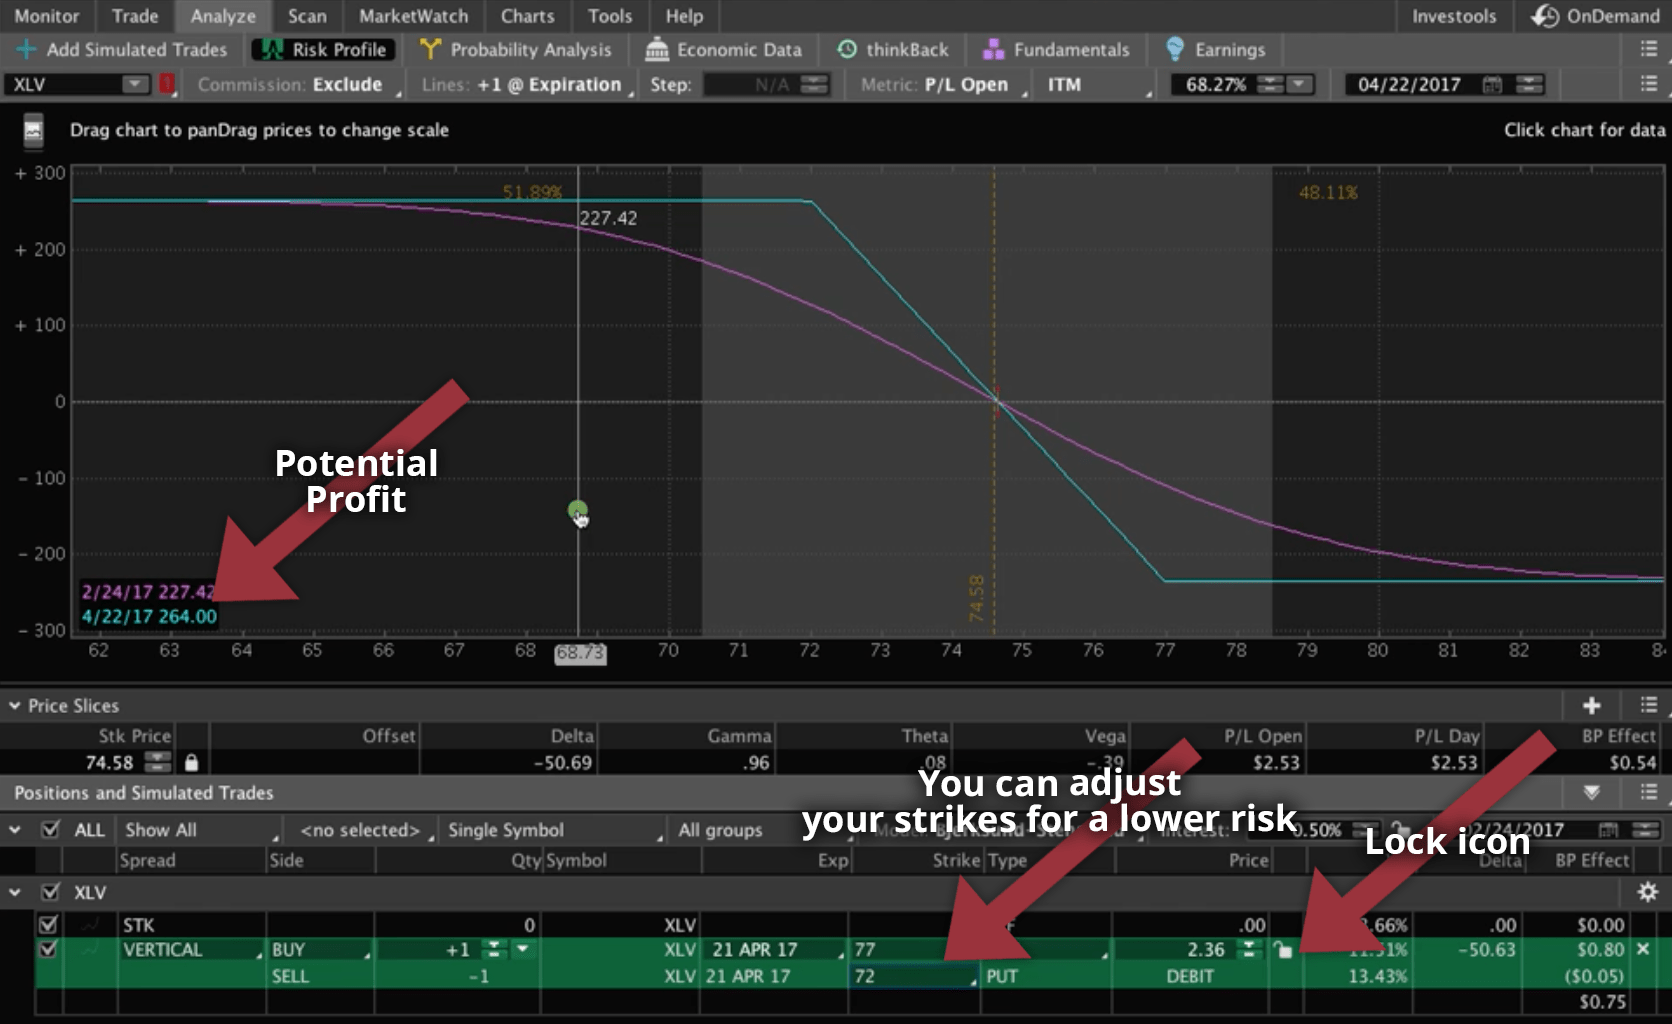
It’s still essentially a 50/50 bet. Look at where the dashed line is. You’ve got about a 48% chance it’s going to close to the upside between now and expiration, and about a 51% chance that it’s going to close to the downside. Essentially, it’s a 50/50 bet.
With this adjusted version, you’re only risking $237 for a max profit of $264. Why would I choose one over the other? It’s just a personal preference. Maybe you’re in a smaller account and you don’t want to risk as much based on the amount you want to risk per trade.
Conversely, the further out you make the strikes, the higher your risk and profit potential. Let’s move our strikes to 79 and 70. Now we’re risking $433 and have a max profit of $467.
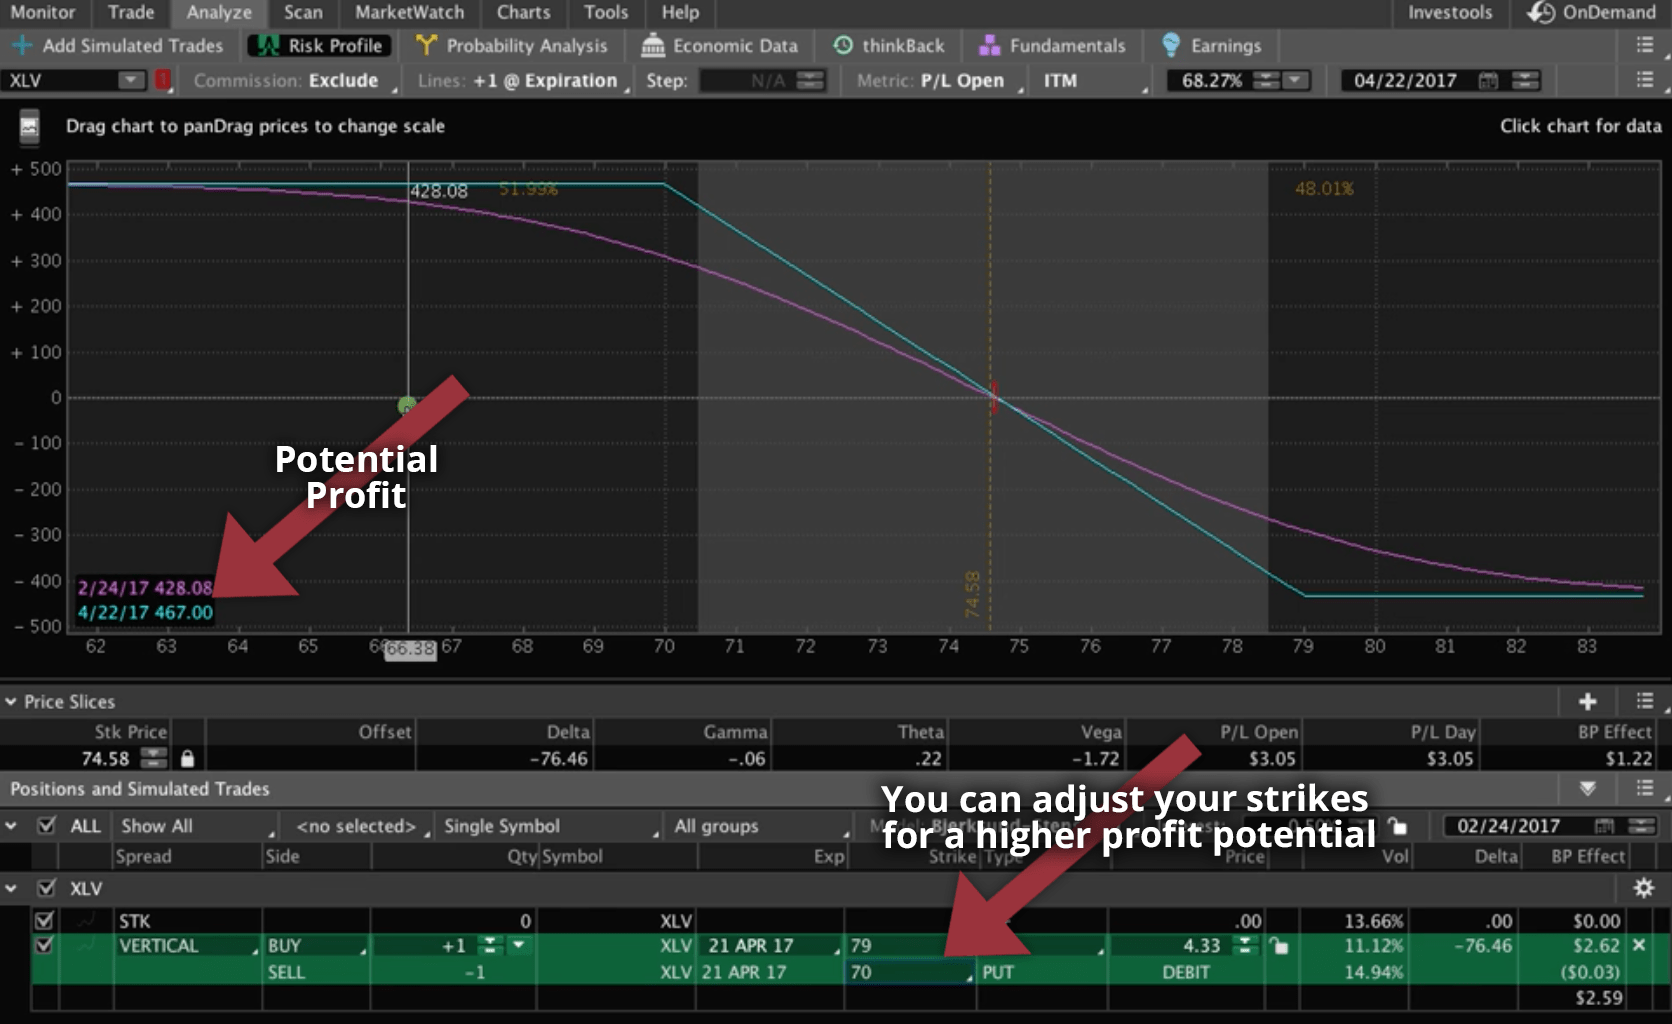
You can adjust the strikes even more, but you’ll be taking on more risk when you do that. Your max profit and max loss are moving further away from price. There’s no right or wrong way to do this, it’s just a preference in how it fits into your overall portfolio.
I’m going to revert back to what we originally had, which was the 78 and 71 strikes, just because these strikes aren’t too close to price. They’re not too far away. I’ve got a good chance, if it just moves down a couple bucks, that I can bank that profit and move on to the next one.
I’m going to go ahead and send this trade in. I’ll kick it up a notch, and do two contracts. I’m risking $682 for a max profit of $718. Again, I’m not going to hold this all the way to expiration. I’m going to take this off at a percentage of max profit, somewhere between 25-50%.
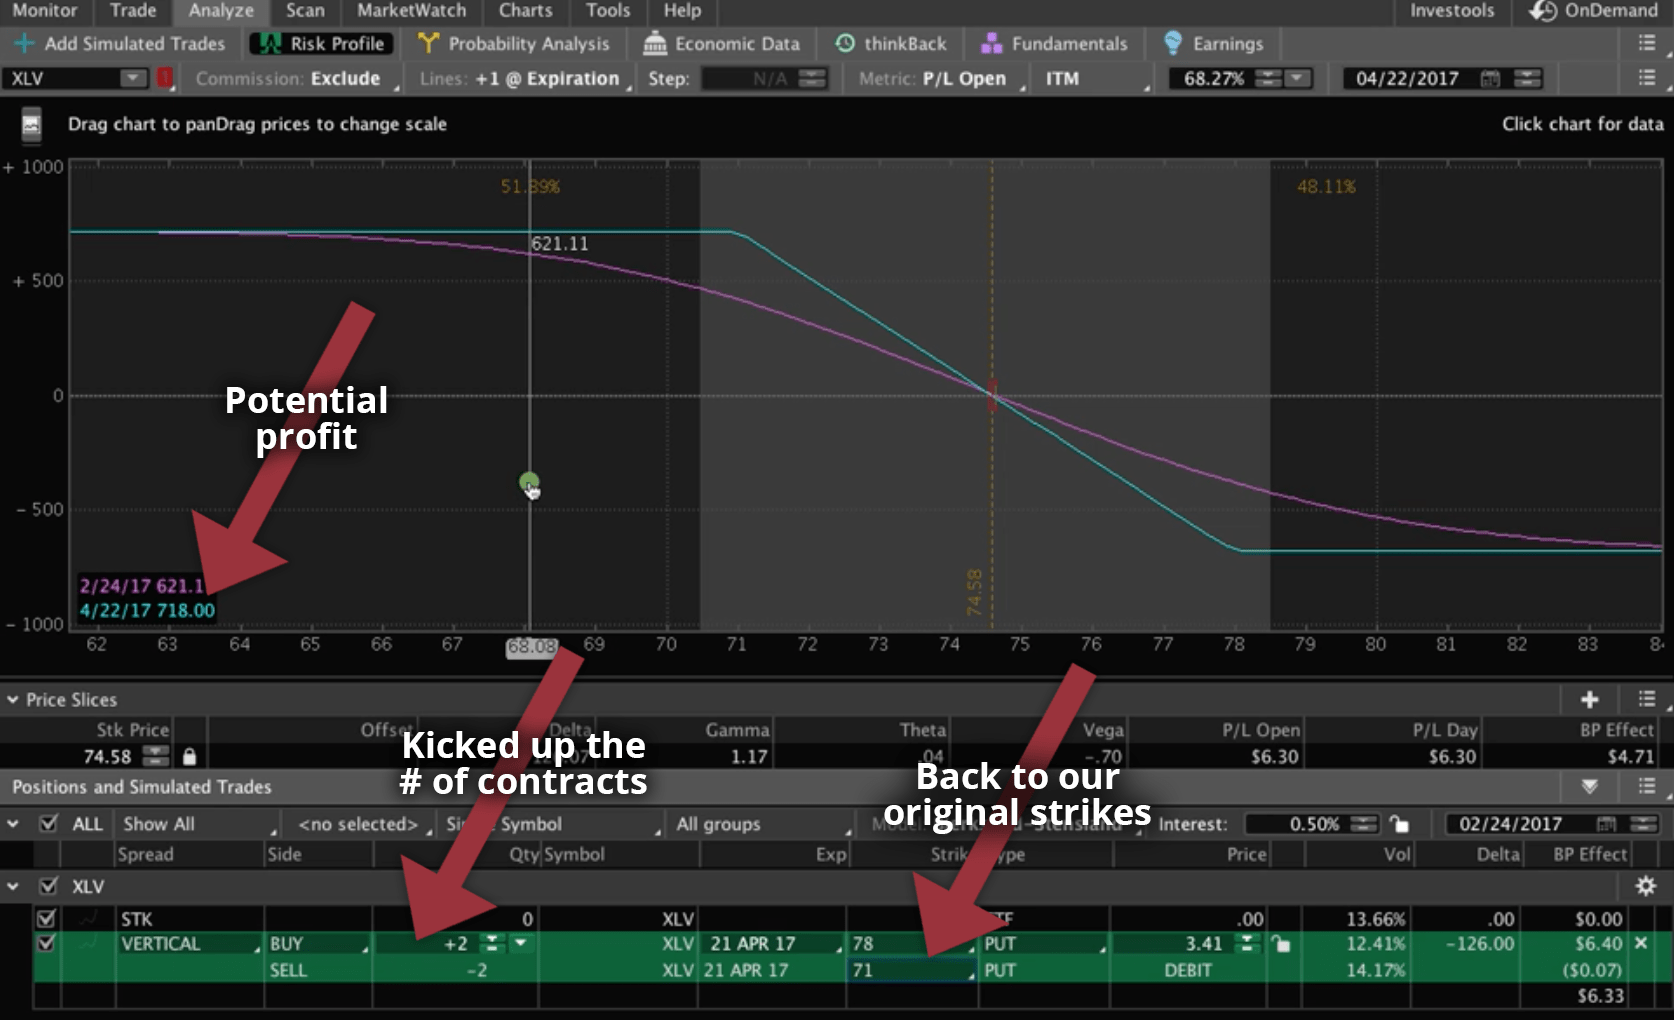
Let’s go ahead and send that to the broker, by right-clicking in the Order Entry area, then select “Confirm and Send”.
We got filled at $3.41, so now we’re in the trade.
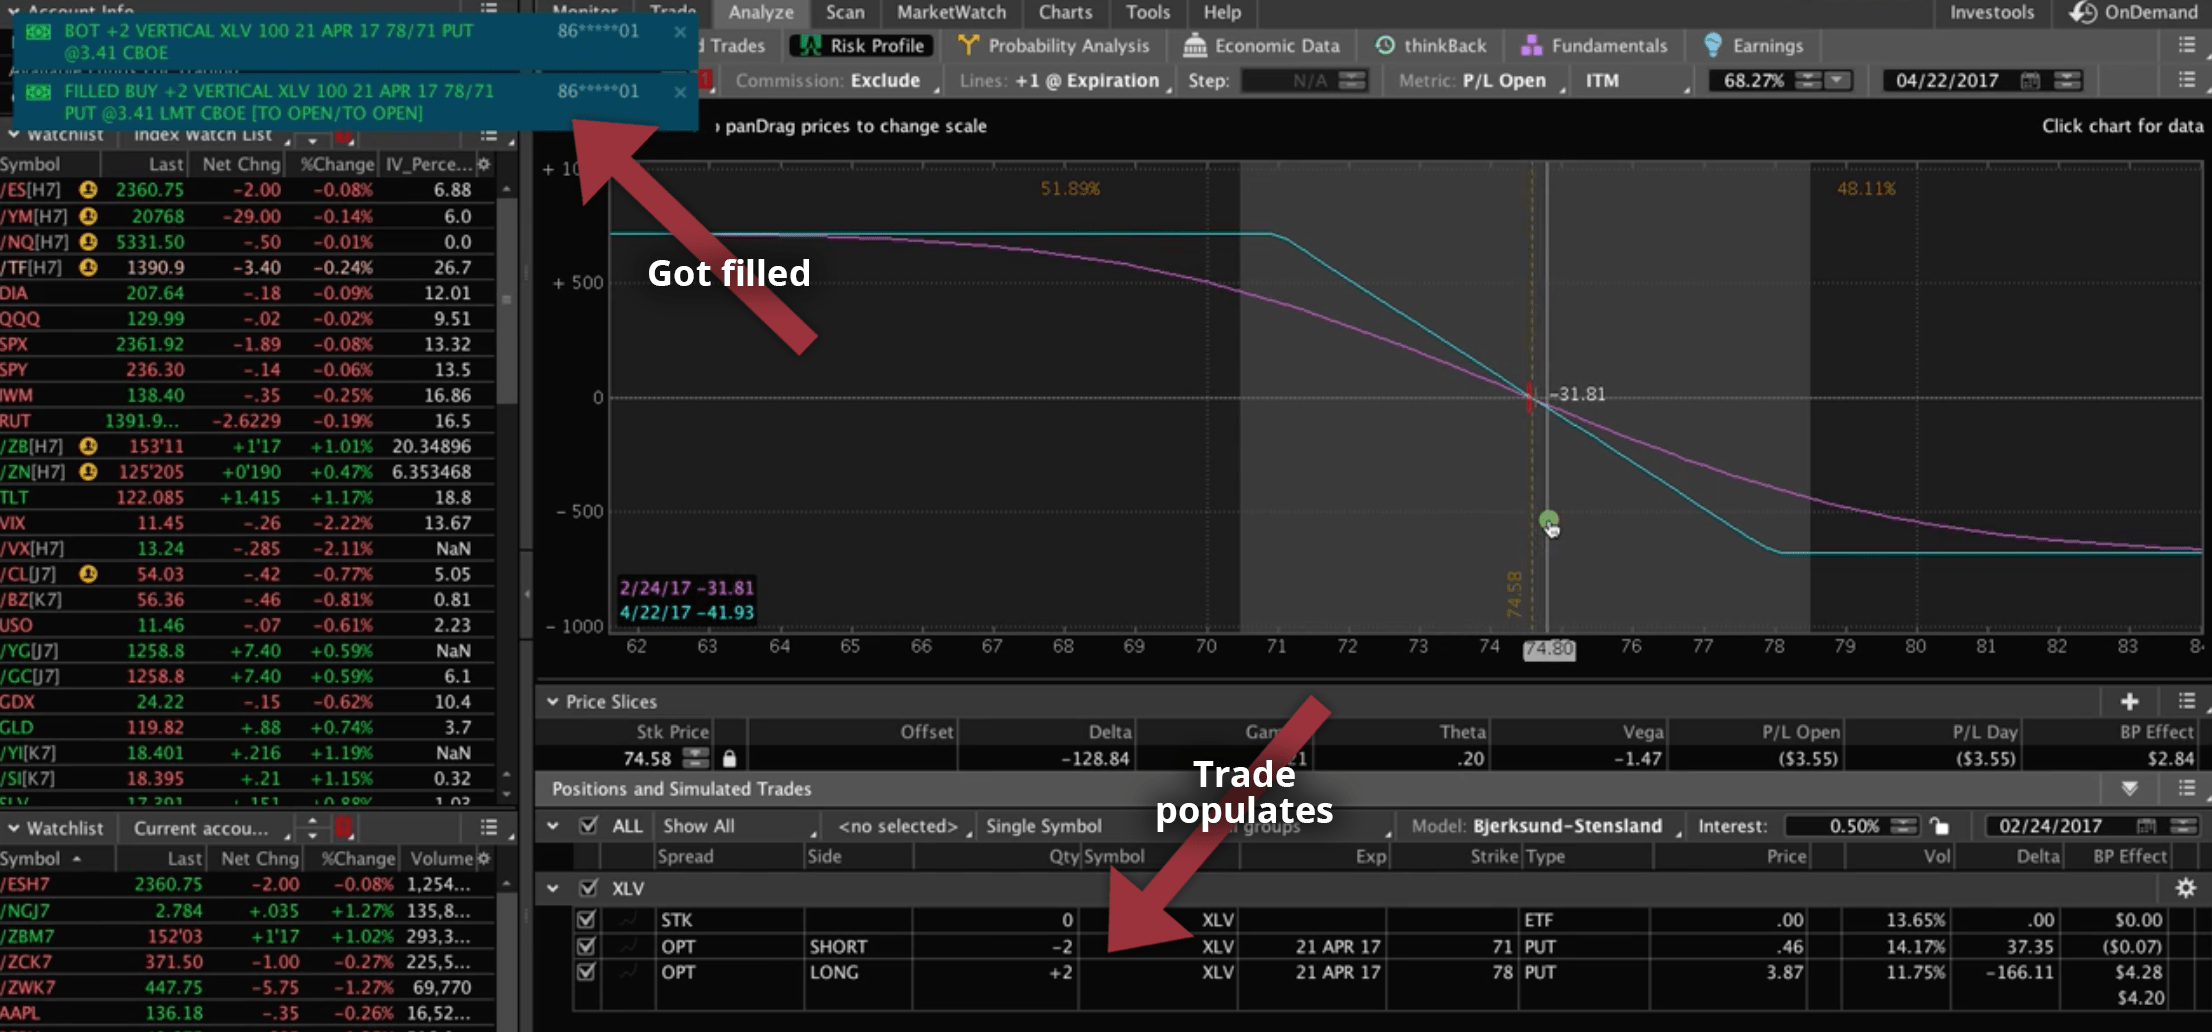
As far as timing, you want to be out of this trade before expiration. If it’s a loser, you’re just going to hold it. It could eventually benefit you by moving down.
If price is somewhere in the middle, not a full loser, and I’m in the last week of expiration, I’m going to go ahead and take it off.
Of course, if the trade is a winner, and I reach a specific percentage of max profit, I’m going to go ahead and book the winner.
I hope this lesson was helpful!
Happy Trading!
-The NavigationTrading Team


Follow