
Hey everyone!
Welcome back to another lesson. In this video, I want to share with you how to set up a Short Strangle on the tastyworks platform.
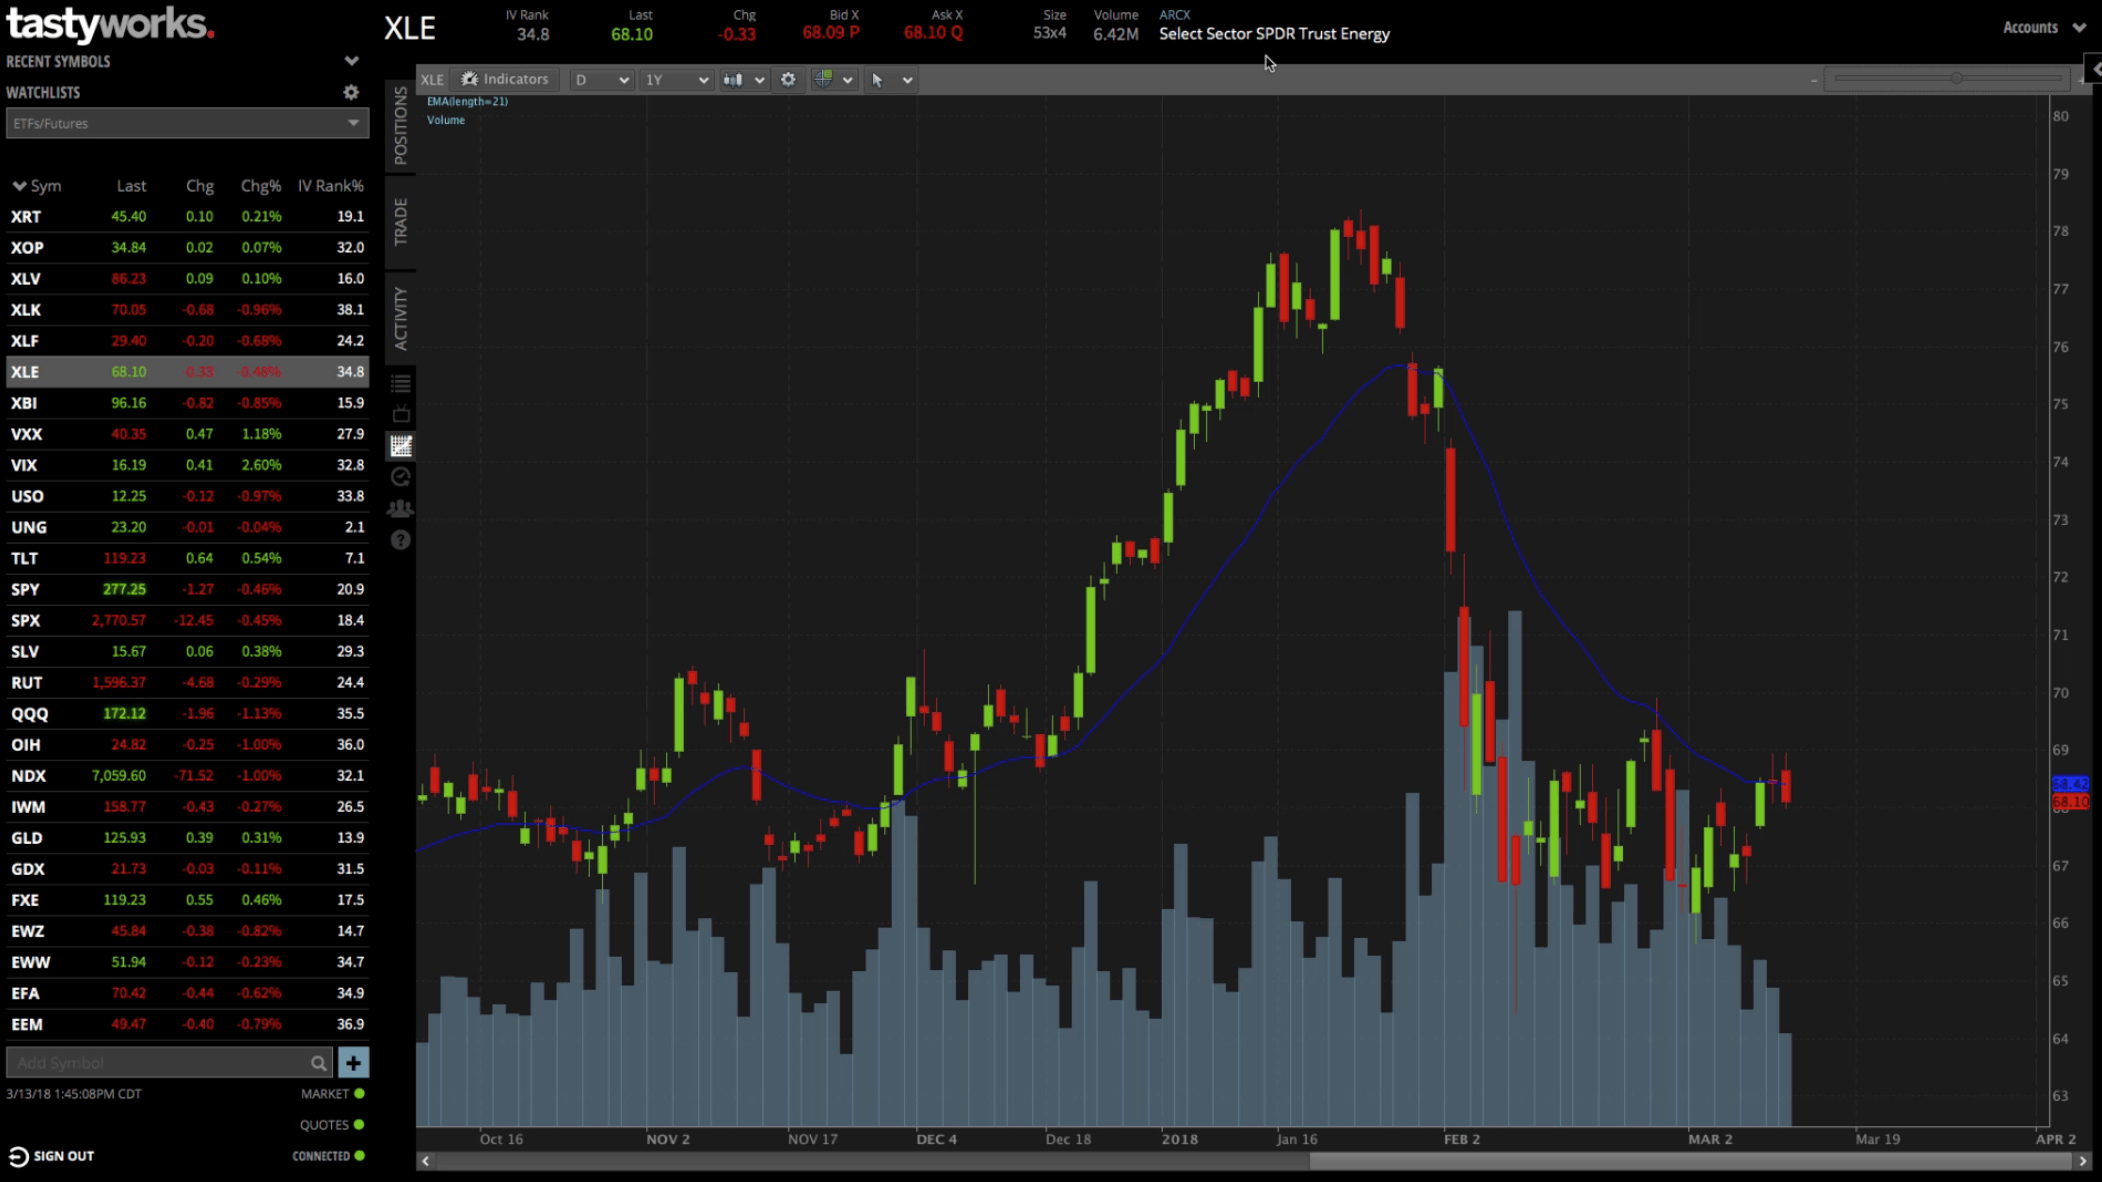
We’re looking at a chart of XLE, which is the SPDR Select Energy ETF. You want to look at the IV rank, which is 34.8, so not bad. The IV percentile, which is not displayed here, is actually much higher in the 80s. That makes this is a good underlying to look at. Plus, it’s got high implied volatility.

Now that we know what we’re dealing with, let’s start going through the motions of setting up a Short Strangle.
Setting Up Your Position
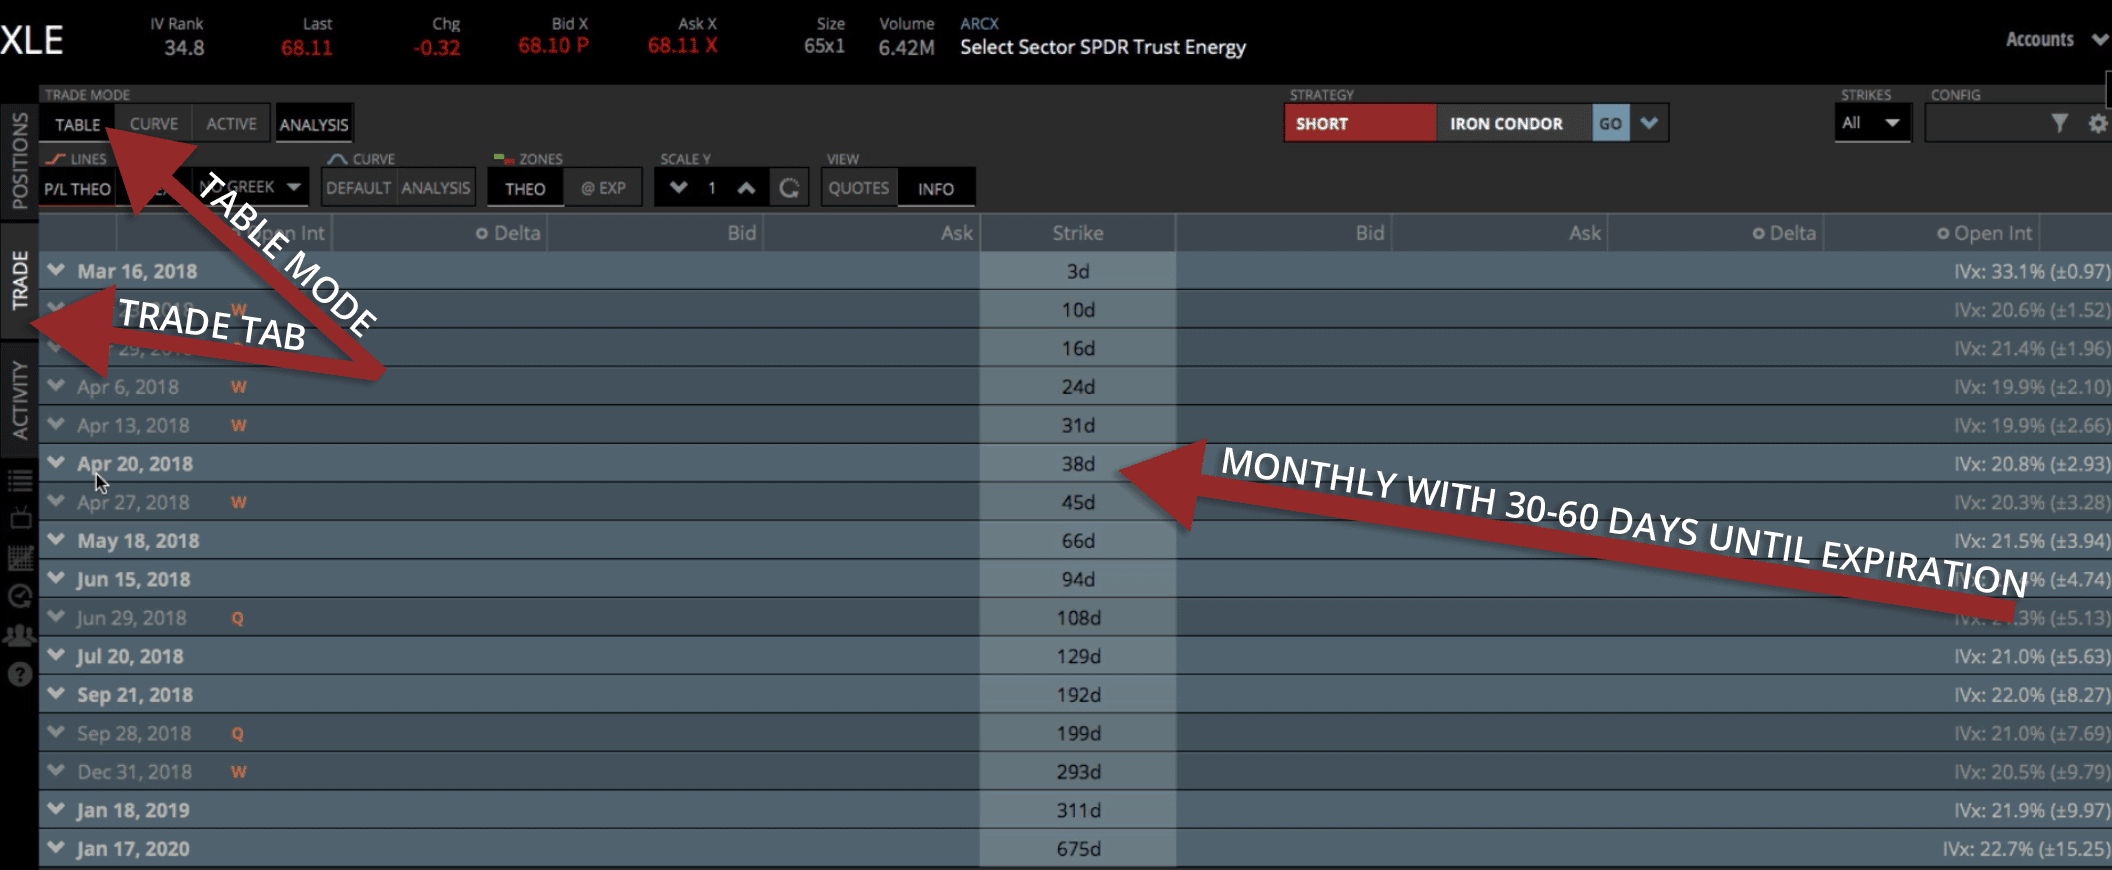
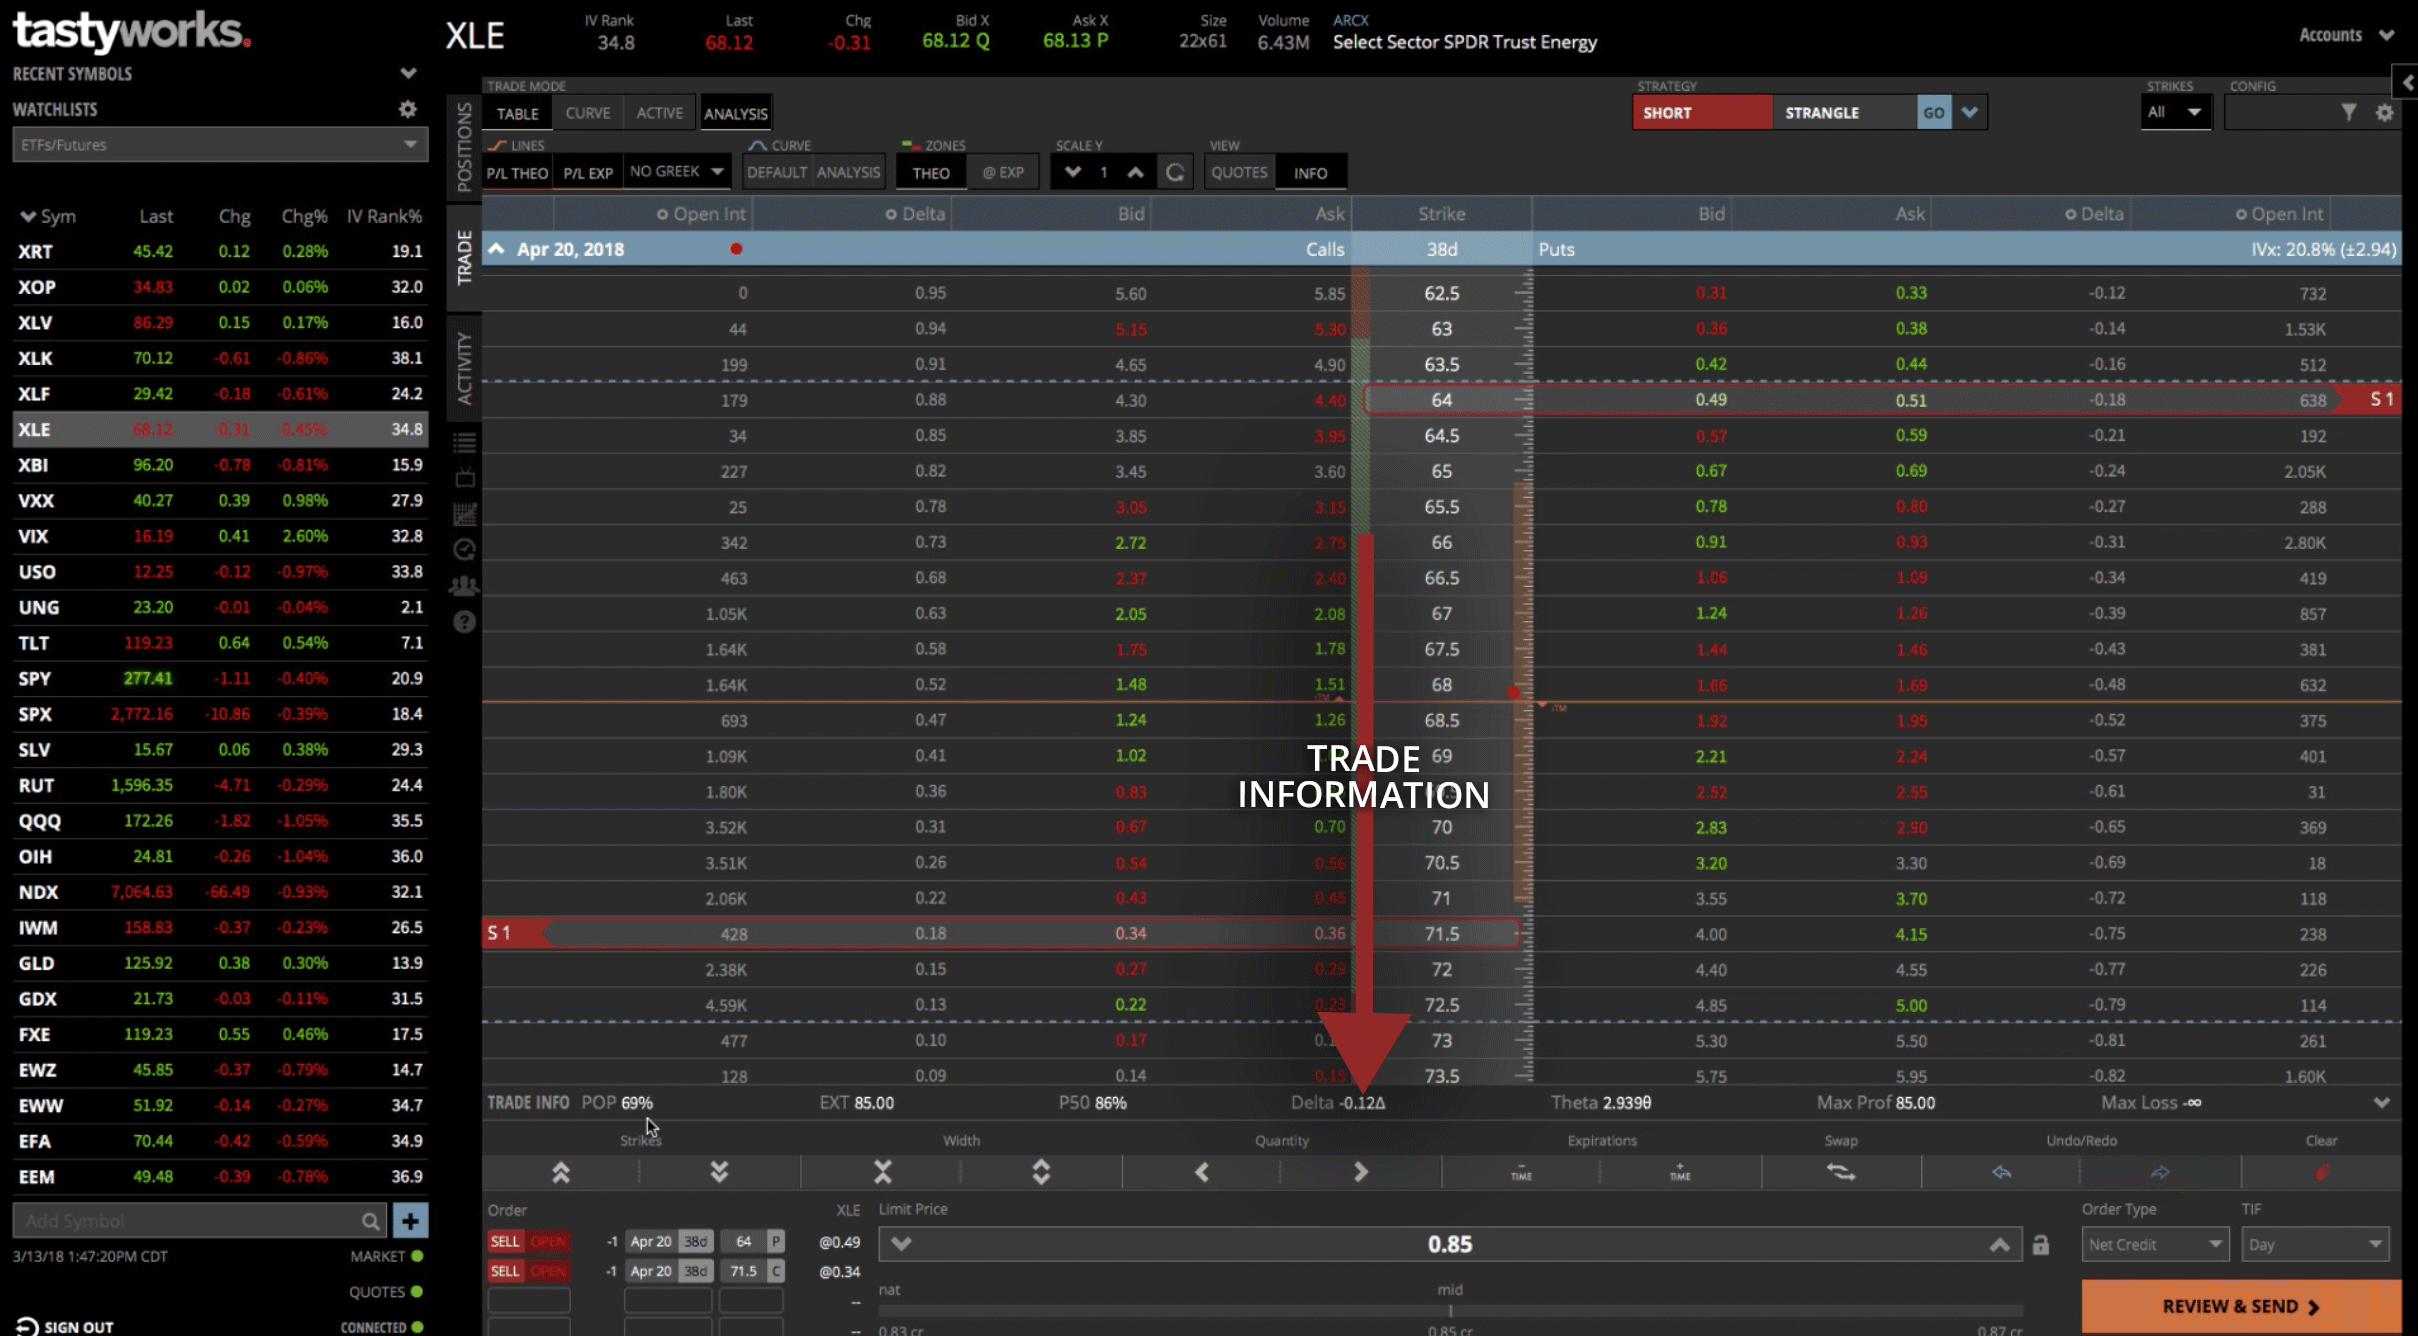
First, you’ll want to make sure that the “Trade” Tab is selected. It’ll pull up the option chains when the “Table” mode is selected.
You can see the April monthlies at the time of the recording have 38 days to expiration. That’s the one we want, right between 30-60 days left to expiration.
You can see the monthlies are distinguished by the bolded white dates. The weeklies and quarterlies are greyed out with a respective “W” or “Q” next to them.
We want to stick to the monthlies. In this case, the April 20 options, with 38 days to expiration, is the one we want to go with. Let’s open those up!

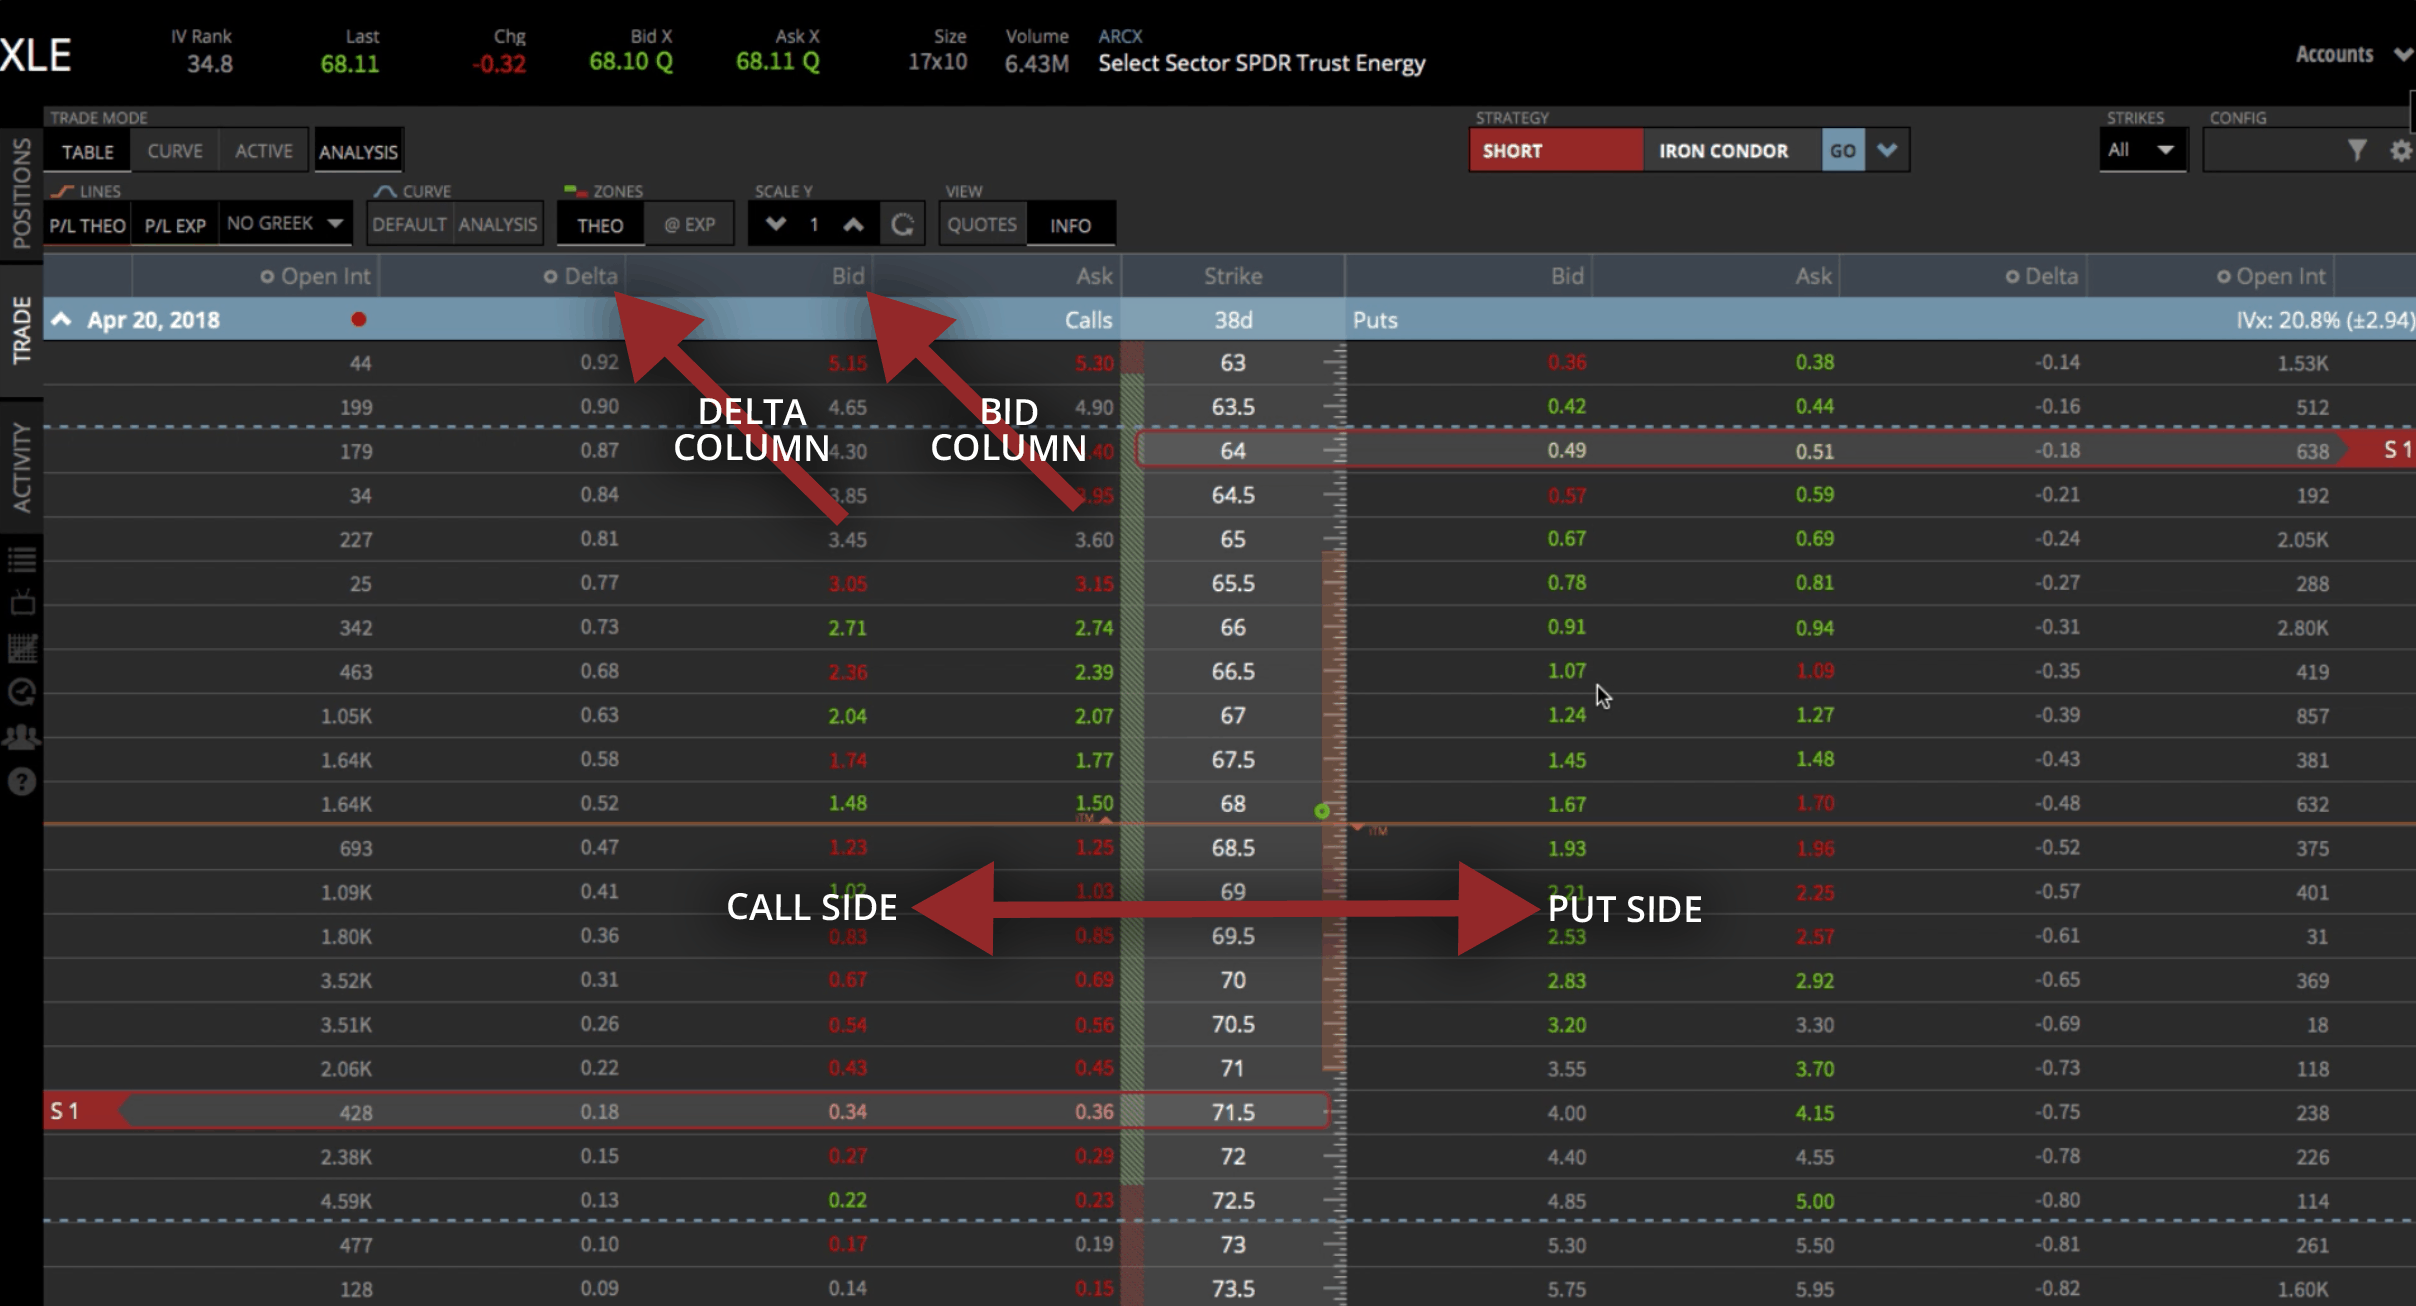
There’s a couple different ways to enter a Short Strangle. One of the easiest ways is to just select your delta. Figure out which delta you want. We typically like to be in that .15-.25ish delta, so let’s look at the .18. You can just click on the bid that’s in the next column on the right. Once you click on the bid, it’ll populate and you’ll see that it’s outlined in red. That means we’re selling that option.
Go over to the put side, do the same thing. Look for about the .18 delta. Just click on the bid to sell, and it’s set up and ready to go.

Strategy Drop Down Method
The other way you could enter a Short Strangle, would be to use the “Strategy” dropdown menu. The Strategy dropdown menu is at the top of the platform over to the right.
You can toggle between “Short” and “Long”. We want to toggle to “Short”, since we’re selling. Select “Strangle” from the dropdown menu of strategies. Then click “Go” and the trade will automatically populate on the platform.
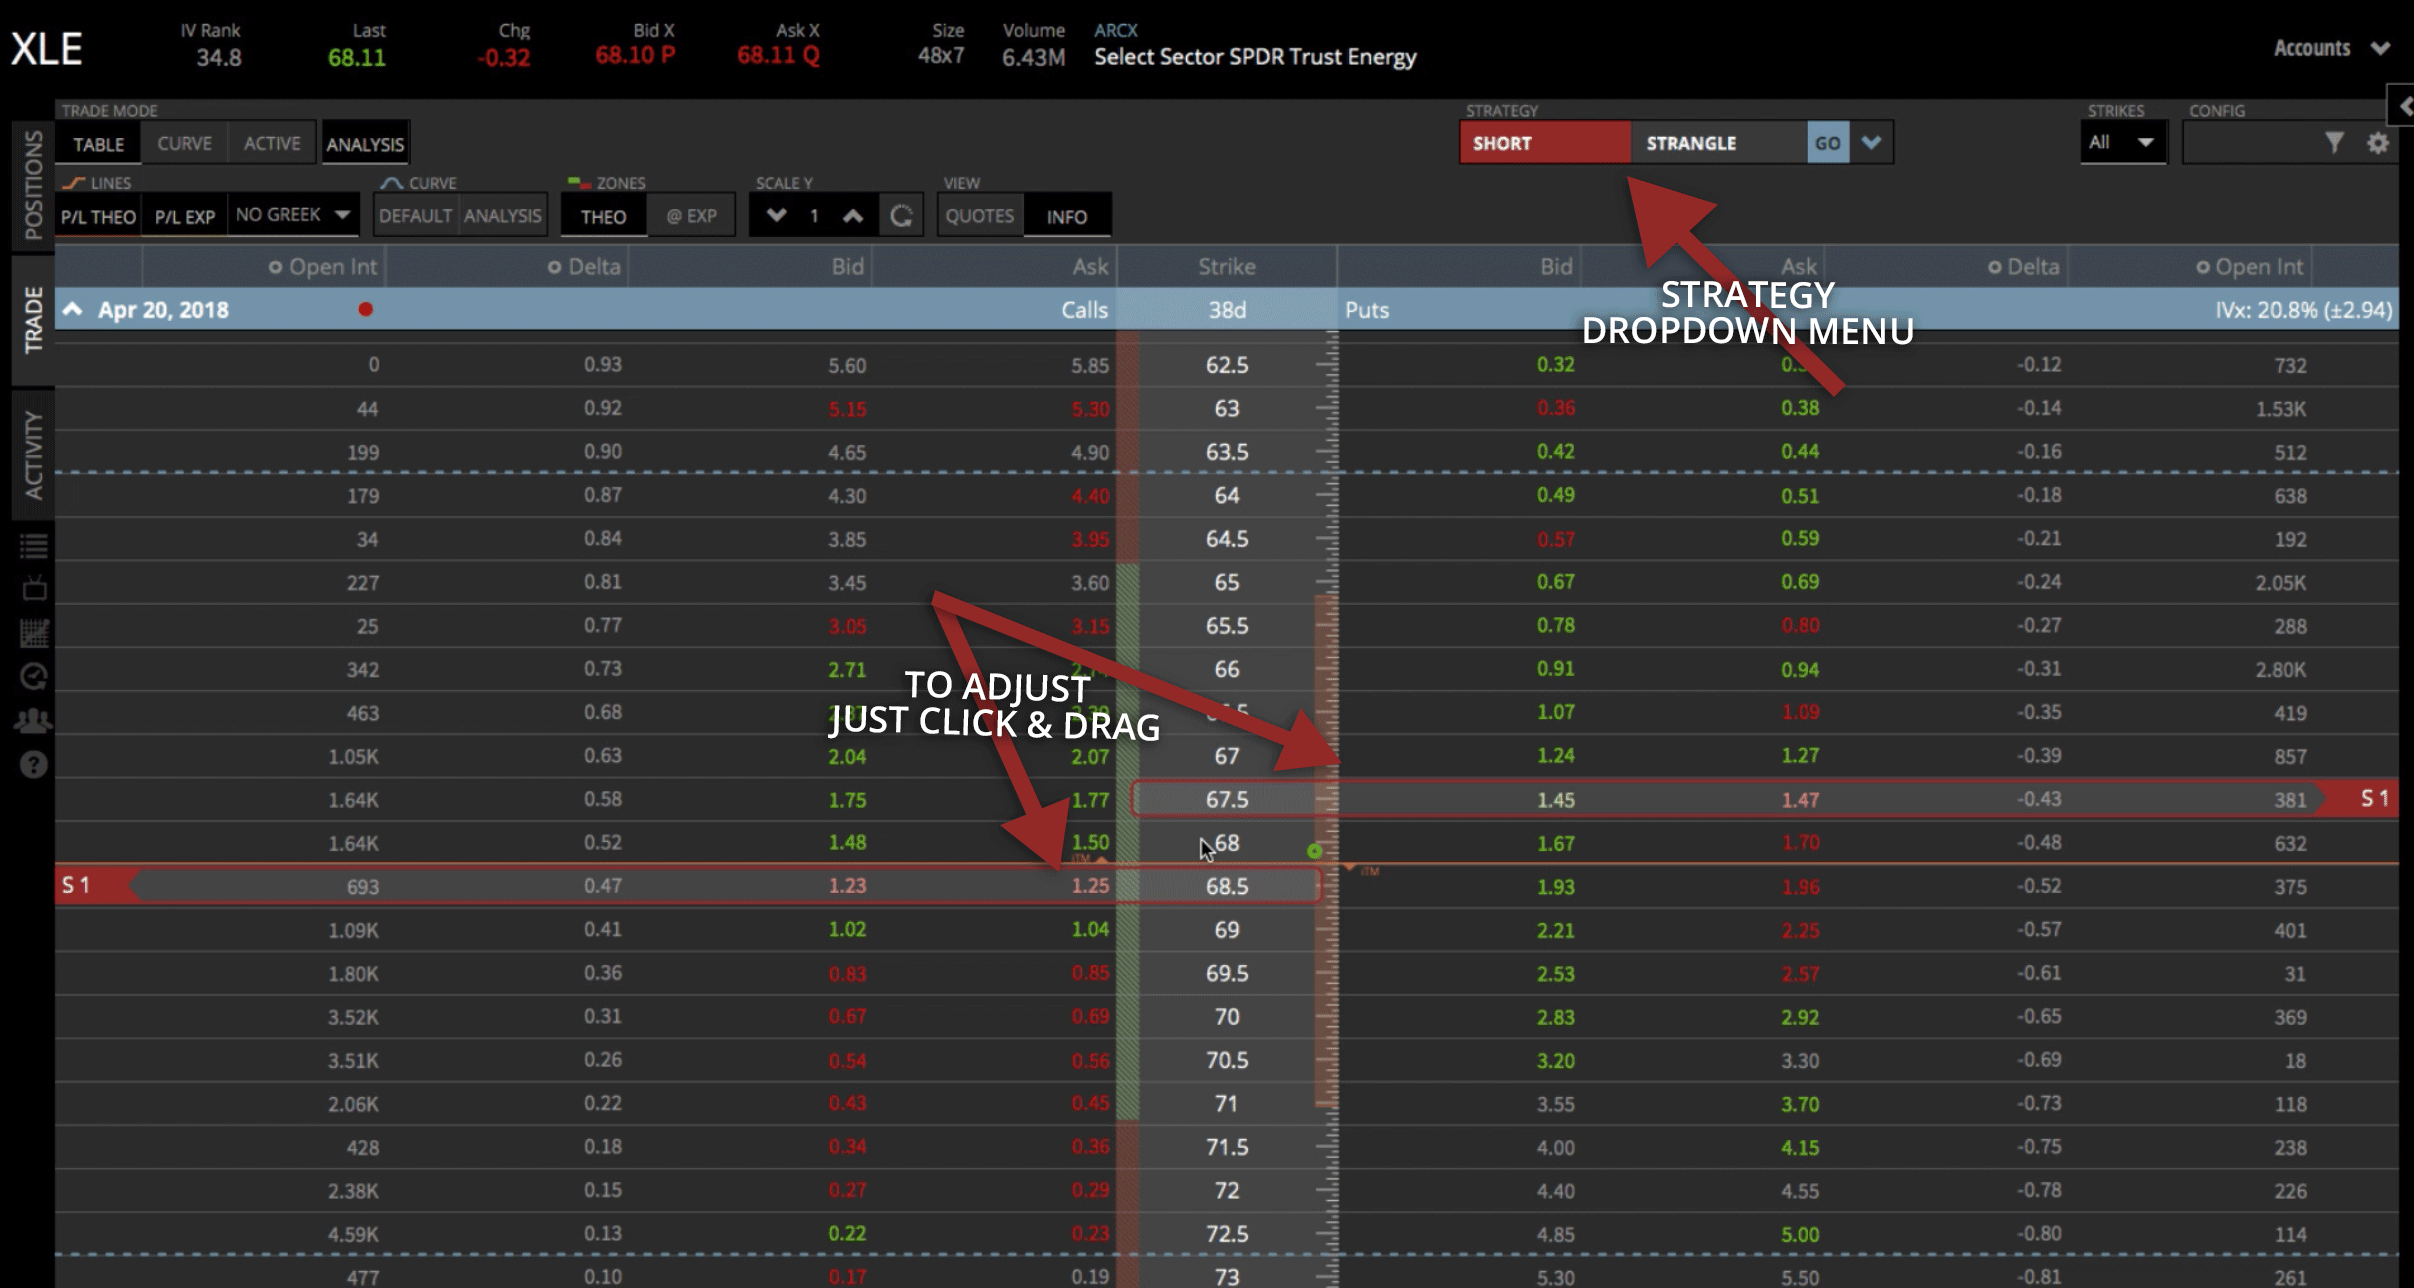

If the trade populates and it’s not where you want it, all you have to do is click and drag. Let’s go ahead and drag it back to that .18 delta on both sides.
And there you have it! It’s all set up and ready to go.
You’ll notice there are some statistics down below. They show that there’s a 69% probability of profit if we held the trade all the way to expiration.
The P50 is another cool statistic to reference. It shows us the probability of the trade making 50% of max profit. In this case, we’ve got an 86% chance.
The info down below also shows you the delta, the theta, as well as the max profit. Obviously, max loss is undefined, because this is a Short Strangle and that’s how it all sets up.
If you’re comfortable with just that information and you’re ready to send it off, you can click “Review & Send” and it’s off to get filled.

Using The Analysis And Curve Mode
Because I’m a visual trader, I like to analyze the trade using the “Analysis” mode. To do this, just click on the “Curve” mode and make sure the “Analysis” box is also selected.
That’ll bring a visual representation up on your screen and you can scroll around to see what your P&L and probabilities are by looking in this little flag here.
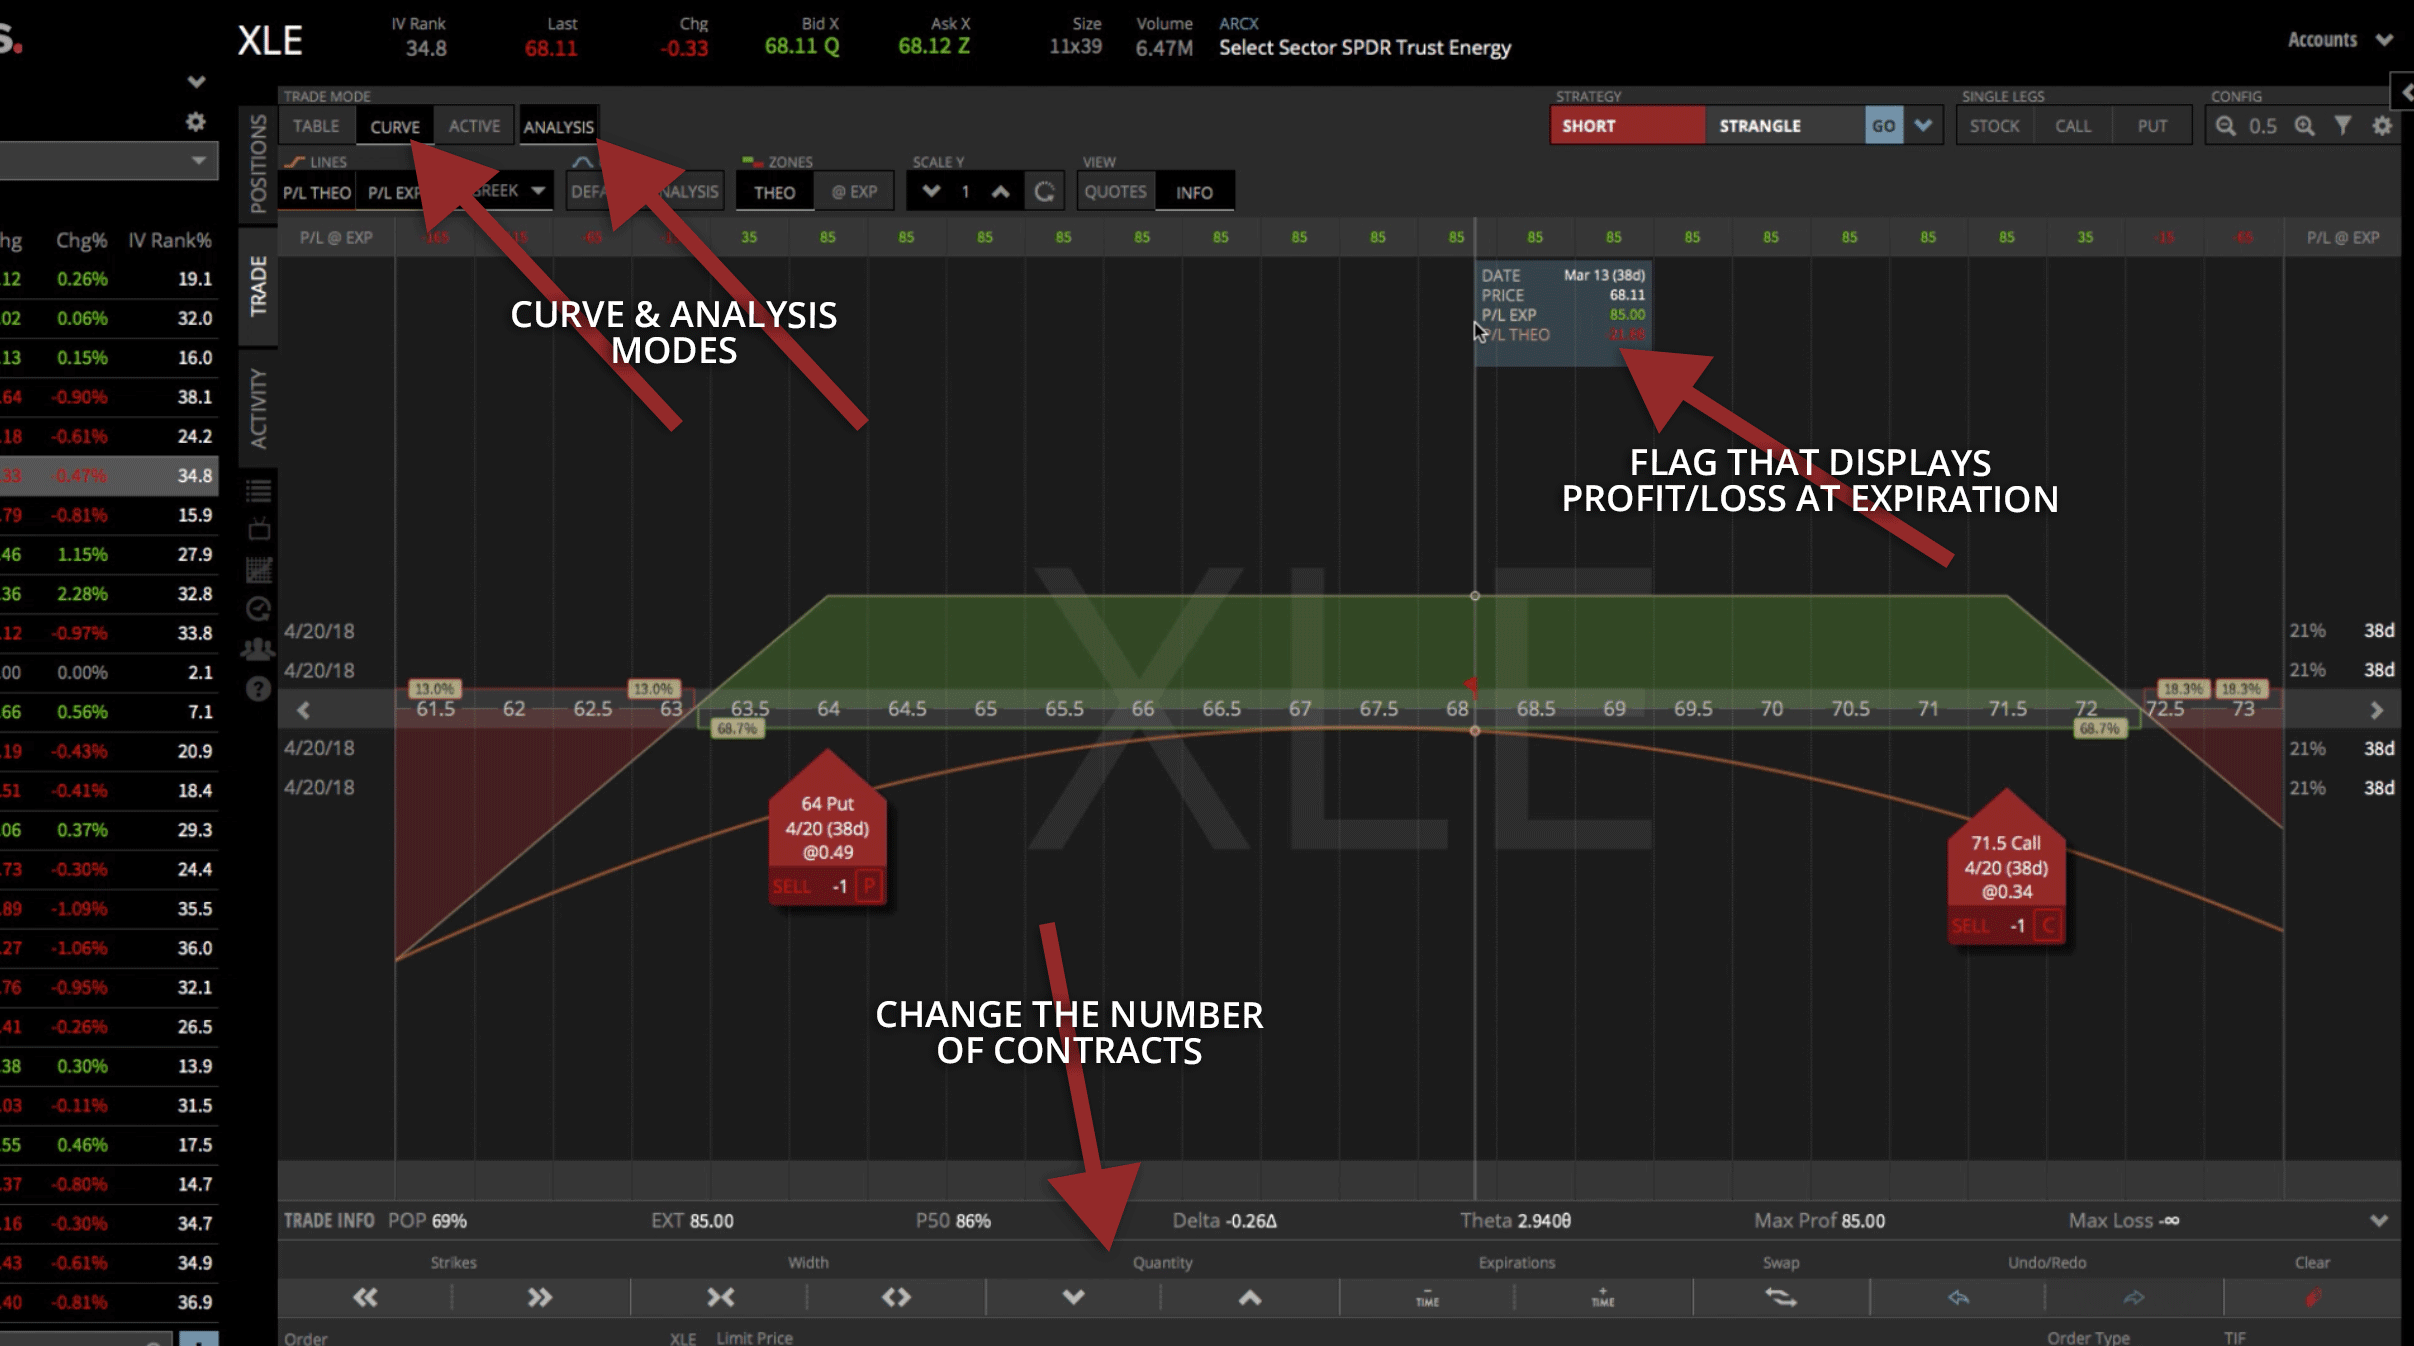

With one contract, we’ve got a max profit at expiration of $85. Of course, you can kick that up a few contracts if you’d like by just tapping on the arrows under “Quantity”. Let’s kick that up to 10 contracts. Now you can see max profit is $850.
Getting Theoretical
Look at the profit line. We haven’t entered the trade yet, so it’s sitting at zero. What if we wanted to take a look at a theoretical movement in the stock?
To do this, open up the pop-out window that’s on the right. From here, we can look at the date. Today is the 13th of March, 2018. But if we click on the arrows, under “Evaluate At Date” to move it through time, look at what happens to our profit line. You can see it’s going up, up, up as we move through time. Once you are finished, click back to today’s date.
The other thing you can look at is implied volatility. Look at the same option chain that we have represented in our graph, which is the April 20 option, with 38 days to expiration. Then you can play with the volatility. If volatility increased, you can see our profit goes down.
When we sell a Strangle, we want volatility to contract. If we show that contracting, you’ll see that the profit line continues to increase as well.
You can play around with these values to get a better idea of how long it might be before you take the profits off and any other type of theoretical situation you might imagine.
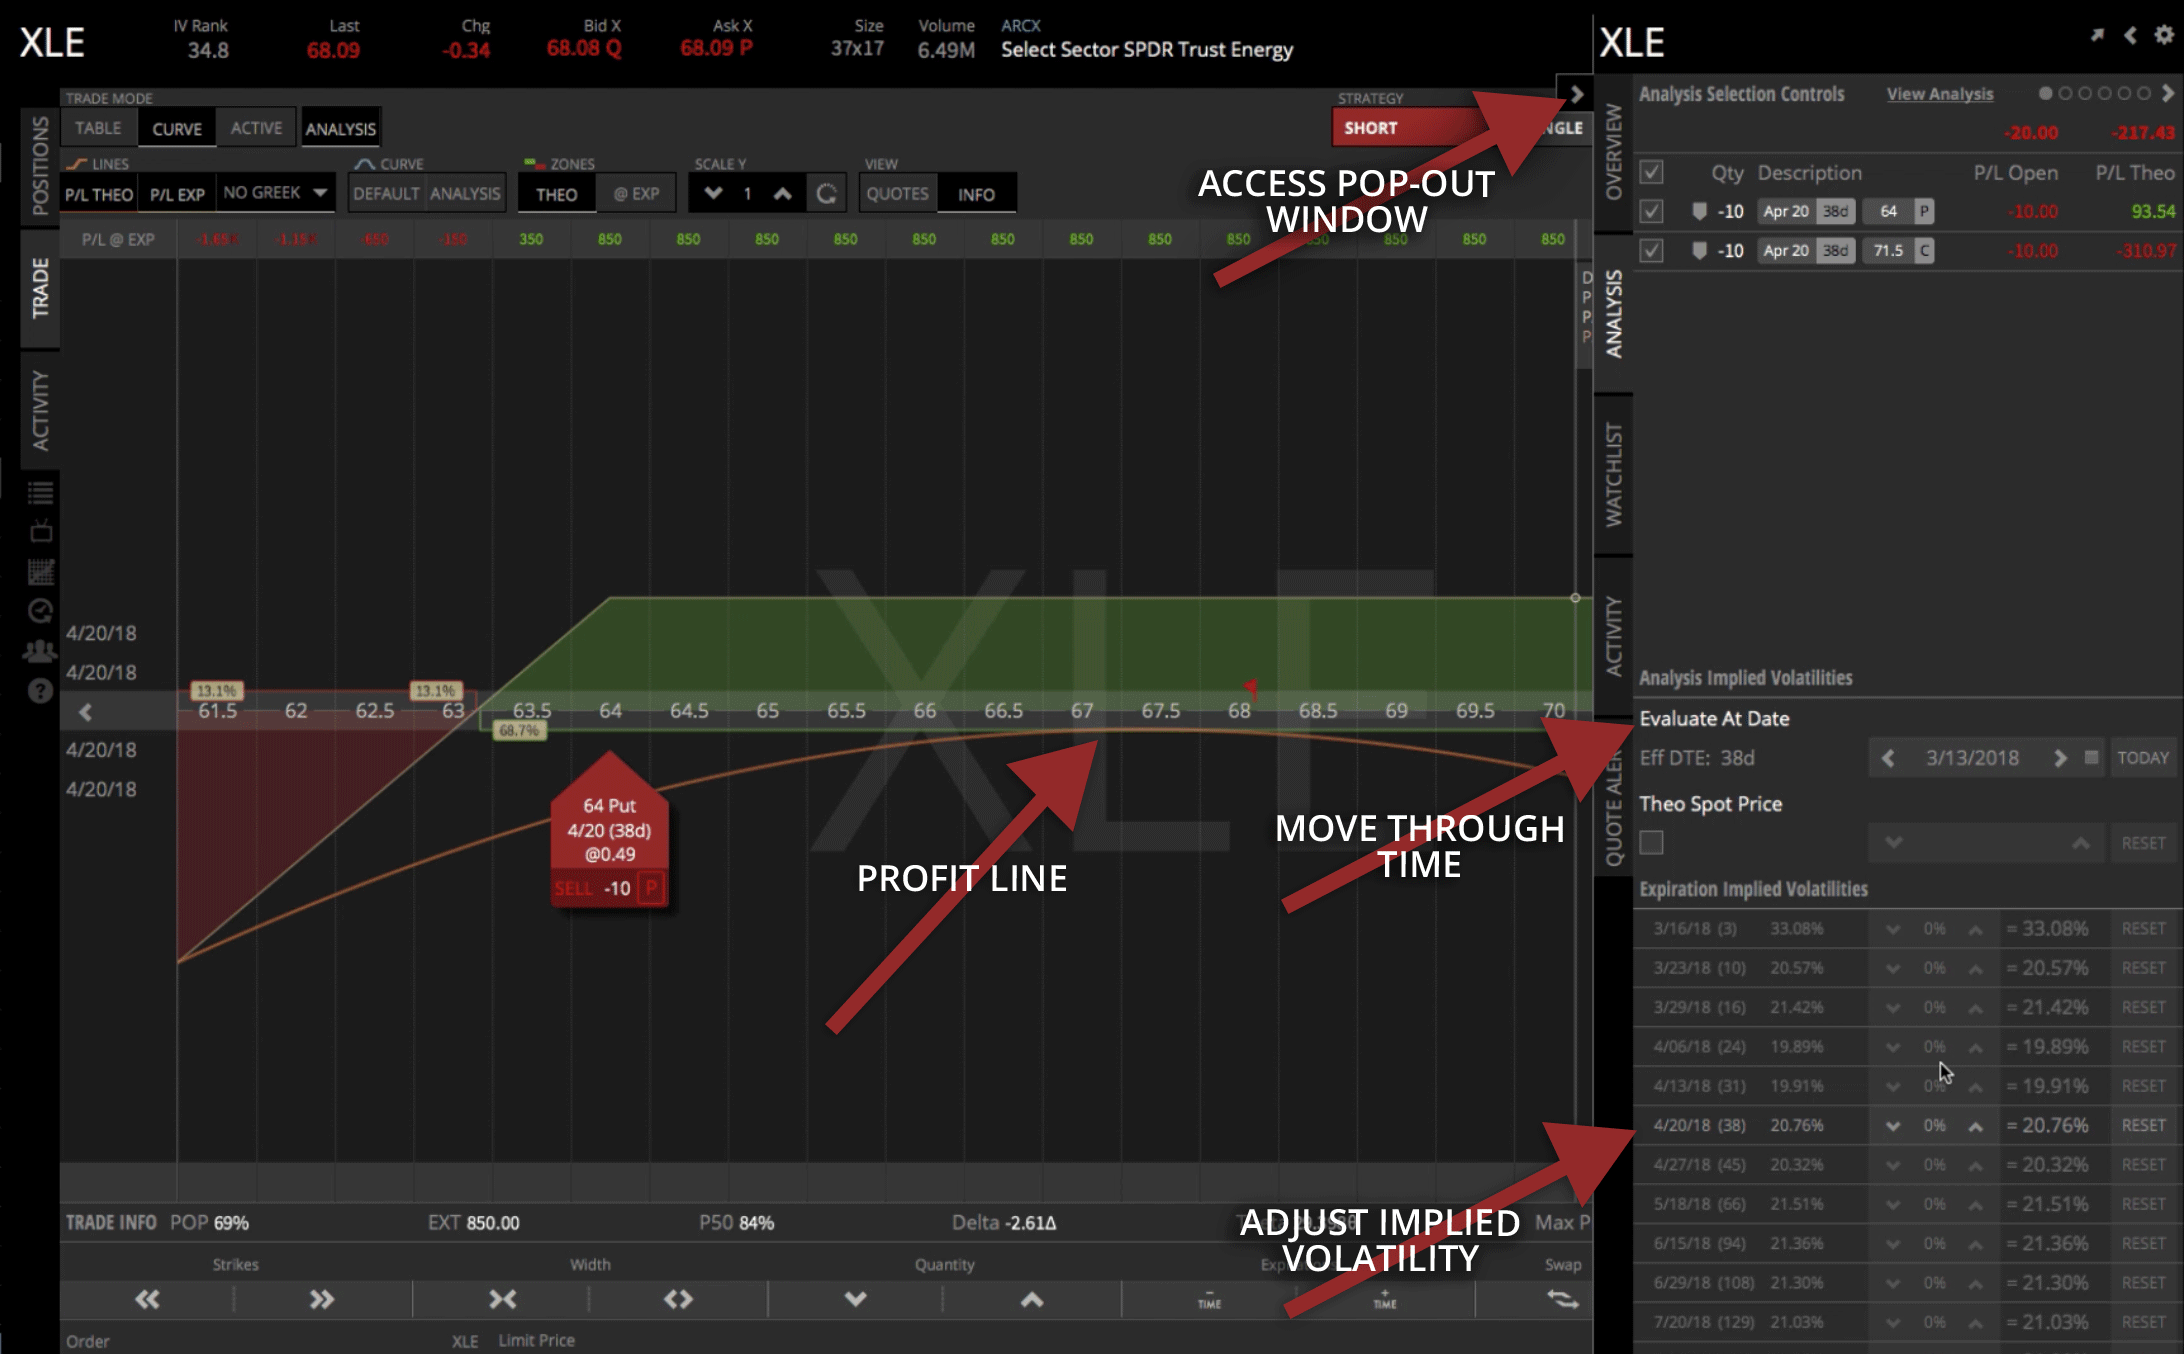

Go ahead and reset the implied volatility and close the pop-out window.
Looking at the statistics on the bottom of the platform, you can see the probabilities are the same as before. Max profit is at $850, probability of reaching 50% is at 84%.
Let’s say you were looking at this and you said, “I want to change my strikes”. You don’t have to go all the way back to the “Table” mode.
You can do it straight from the “Curve” mode with “Analysis” selected, by just clicking and dragging the red tabs which represent your strikes.
Let’s say we wanted to get this a little bit tighter, a little bit closer to price…All you would have to do is click and drag. Click and drag both tabs inward, and now you can look at your statistics.
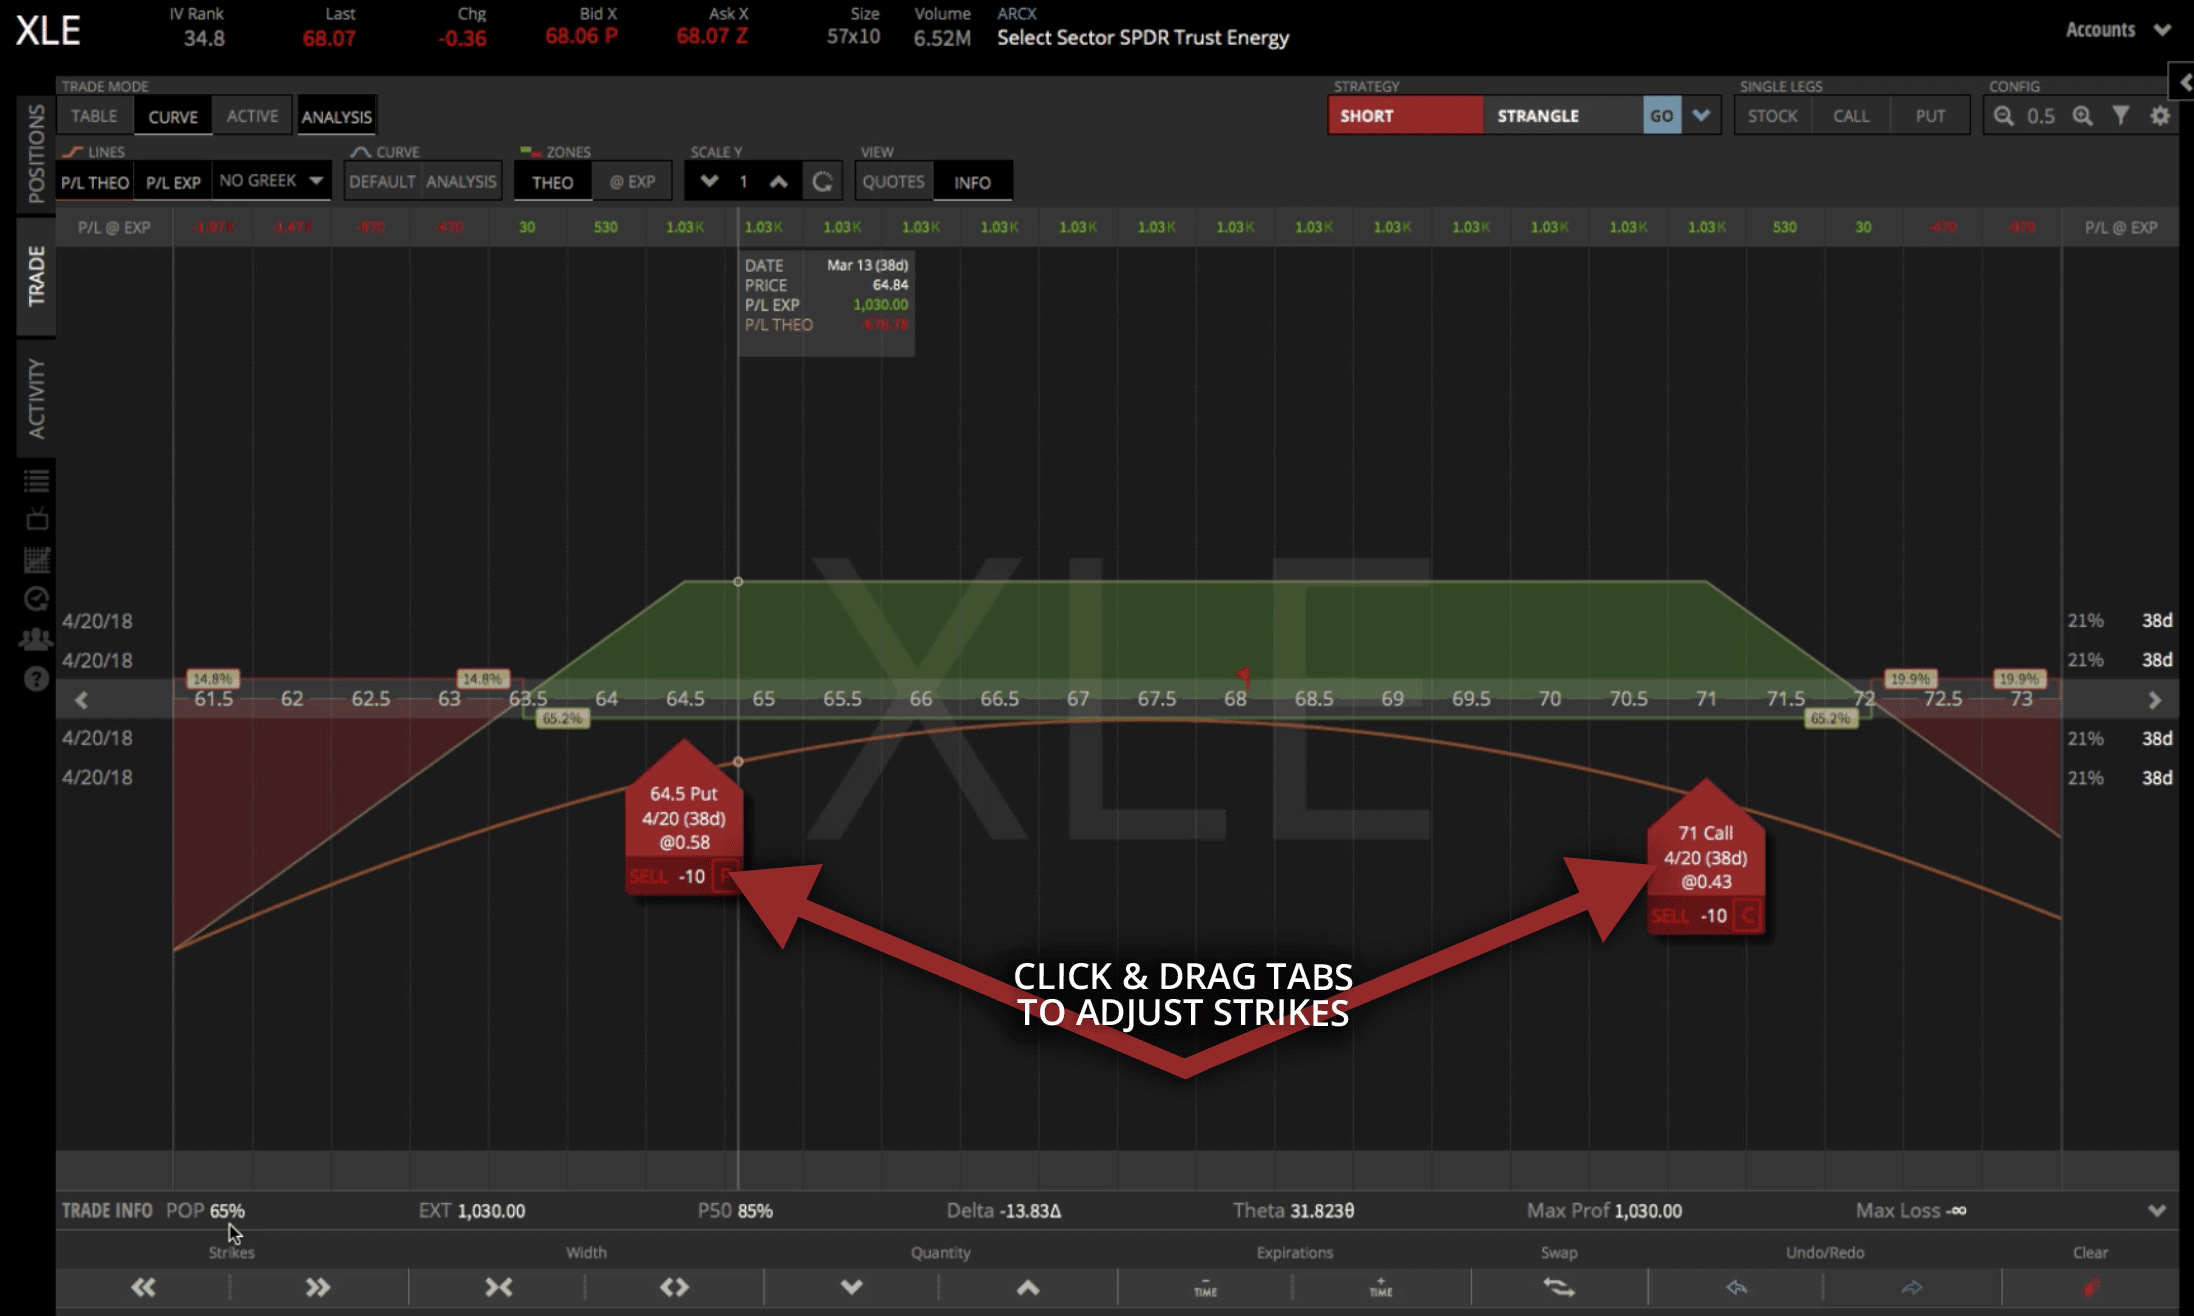

Probability of profit is at 65%, P50 is at 85% and the max profit is now at $1,020. You can see your theta has adjusted, and everything is set up and ready to go.
When you’re ready, just click “Review & Send” to shoot that off to your broker and get it filled.
I hope that was helpful in showing you how to trade a Short Strangle in tastyworks. See you in the next lesson!
Happy Trading!
tastyworks, Inc. (“tastyworks”) has entered into a Marketing Agreement with Navigation Financial, LLC (“Marketing Agent”) whereby tastyworks pays compensation to Marketing Agent to recommend tastyworks’ brokerage services. The existence of this Marketing Agreement should not be deemed as an endorsement or recommendation of Navigation Financial, LLC by tastyworks and/or any of its affiliated companies. Neither tastyworks nor any of its affiliated companies is responsible for the privacy practices of Navigation Financial, LLC or this website. tastyworks does not warrant the accuracy or content of the products or services offered by Navigation Financial, LLC or this website. Navigation Financial, LLC is independent and is not an affiliate of tasty works.

Follow