
Hey everyone, welcome to another lesson from NavigationTrading!
In this video I want to show you how to trade a Calendar Spread on the tastyworks platform. We’re looking at ticker GLD, which is the Gold ETF.
When we put on Calendar Spreads, we like to do that when implied volatility is low. In this case, GLD has an IV rank of 11.3, which is pretty low. We like it to be under 10, but 11.3 will work for this example.
Manually Setting Up A Calendar Spread
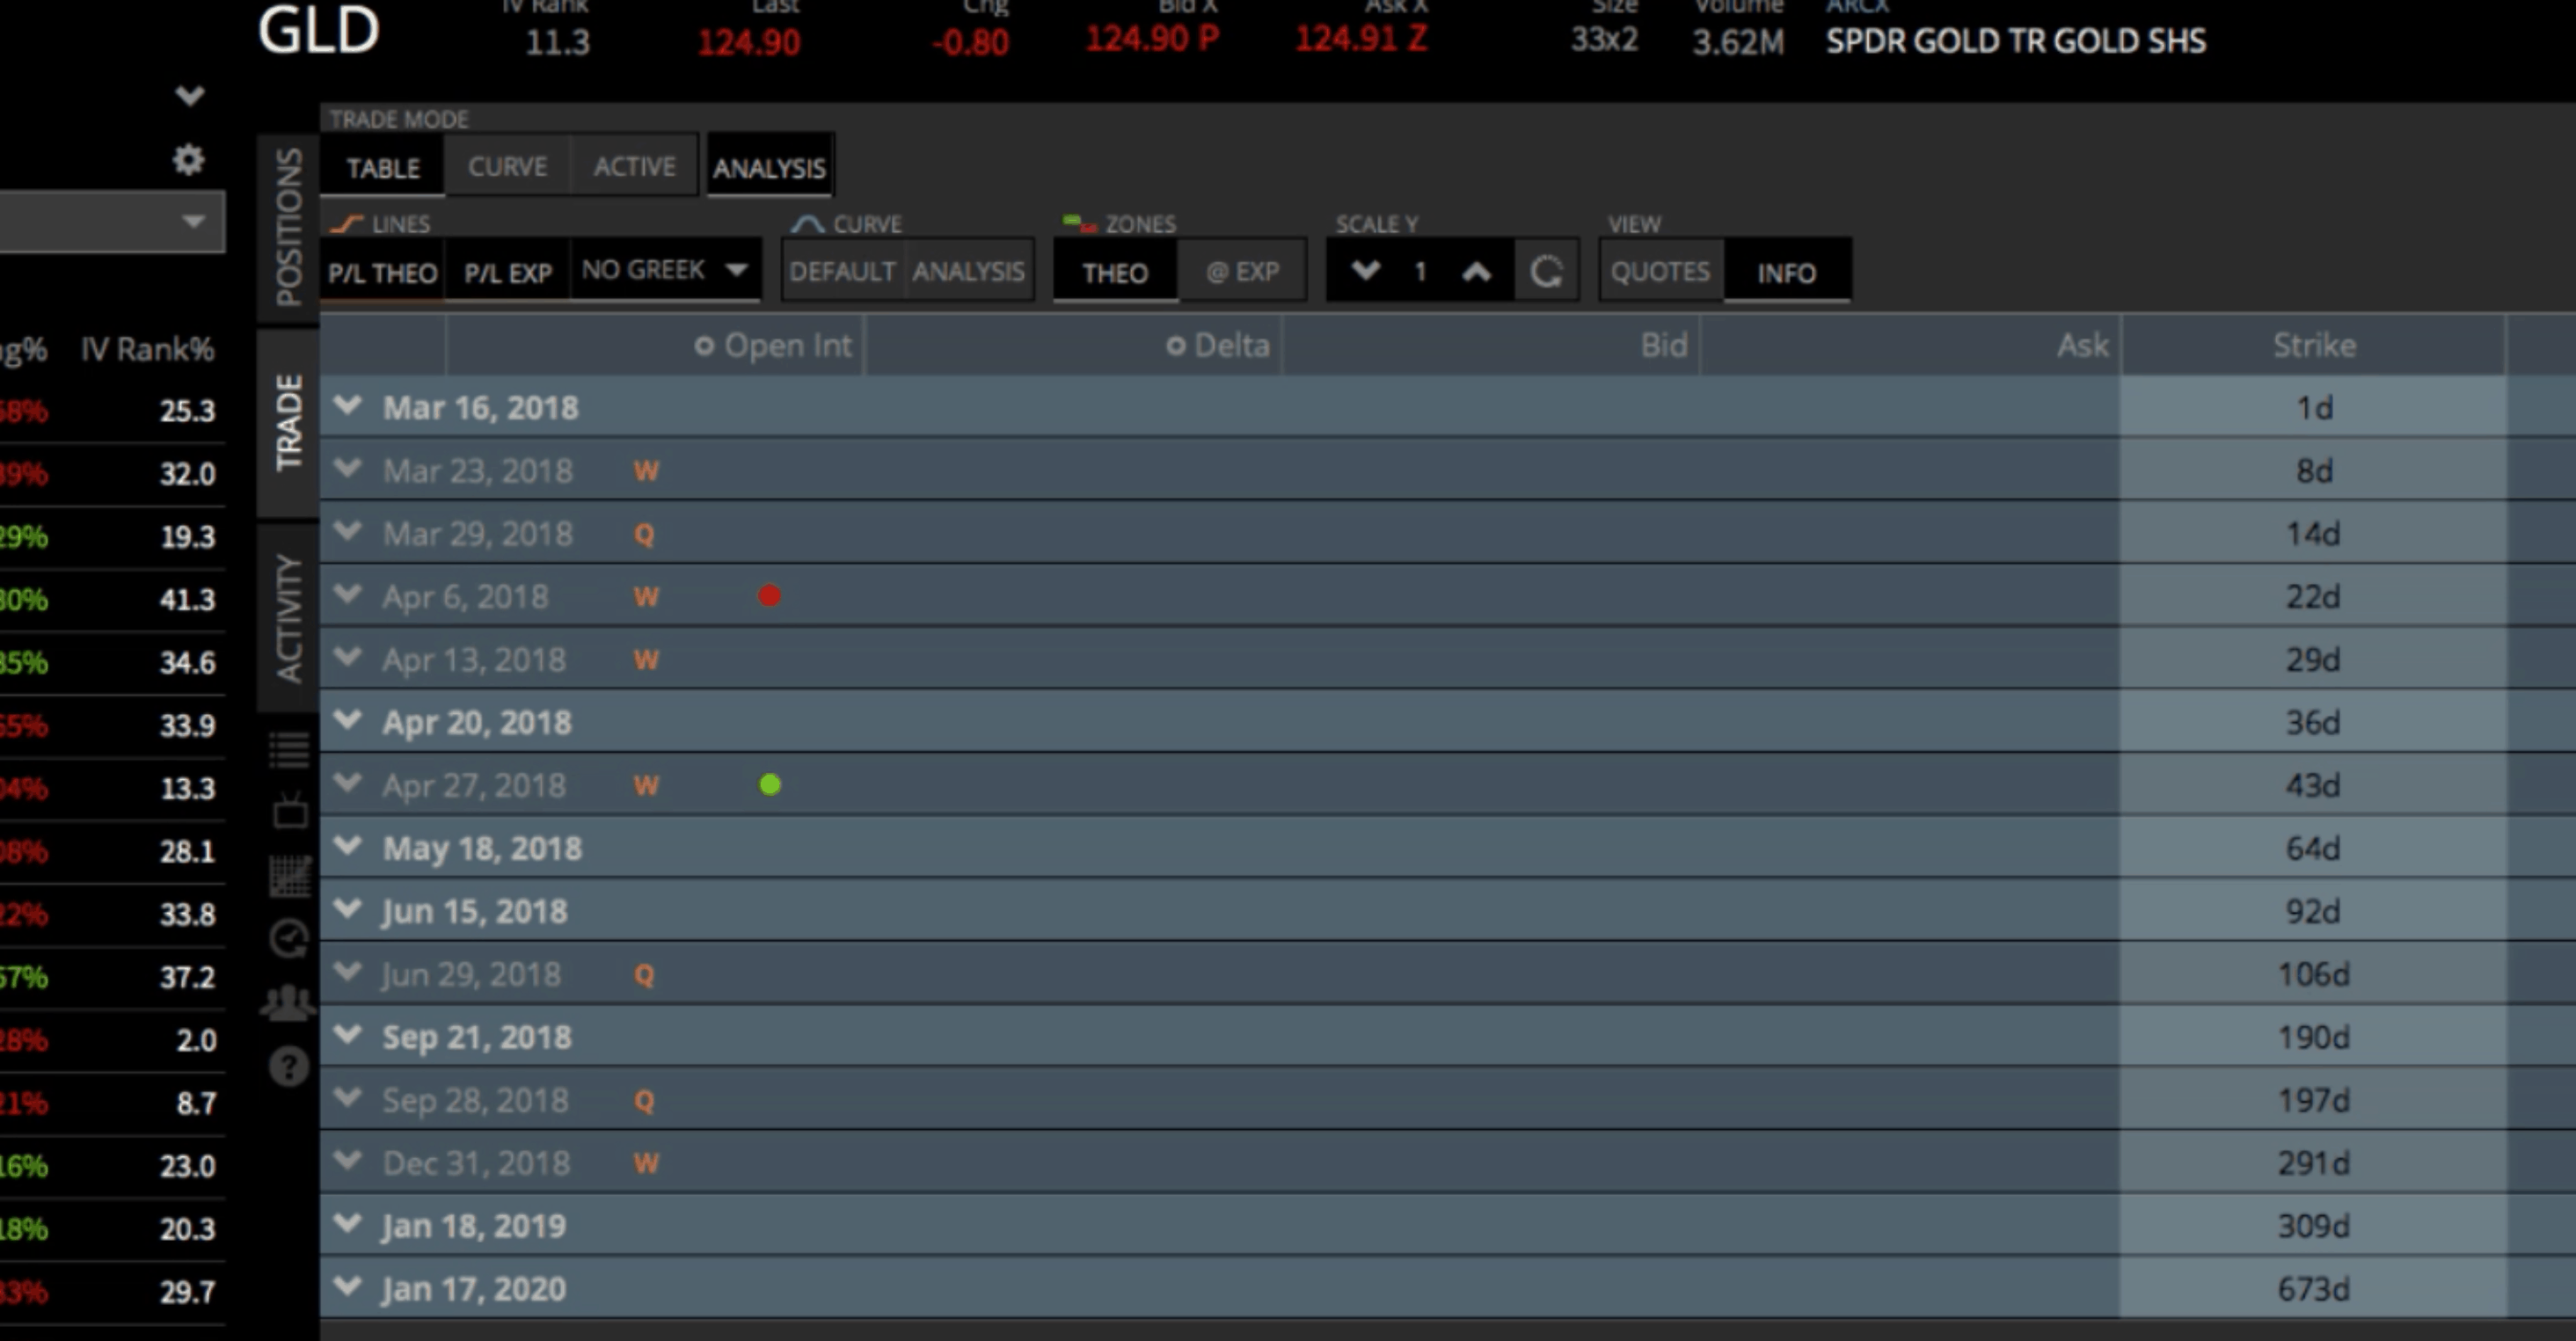
The first thing we’re going to do is open the trade tab, and look for options with 30-60 days left to expiration. In this case, the April options to have 36 days to expiration. We always stick with the monthly options, which are bolded in white.
If we open those option chains, you’ll see the different strikes available. We like to place these pretty close to at-the-money. If you have a little bit of a bias to the downside, you can skew it down a little bit, or to the upside. For the most part, we like to stick right around the money, which is indicated by the orange line.
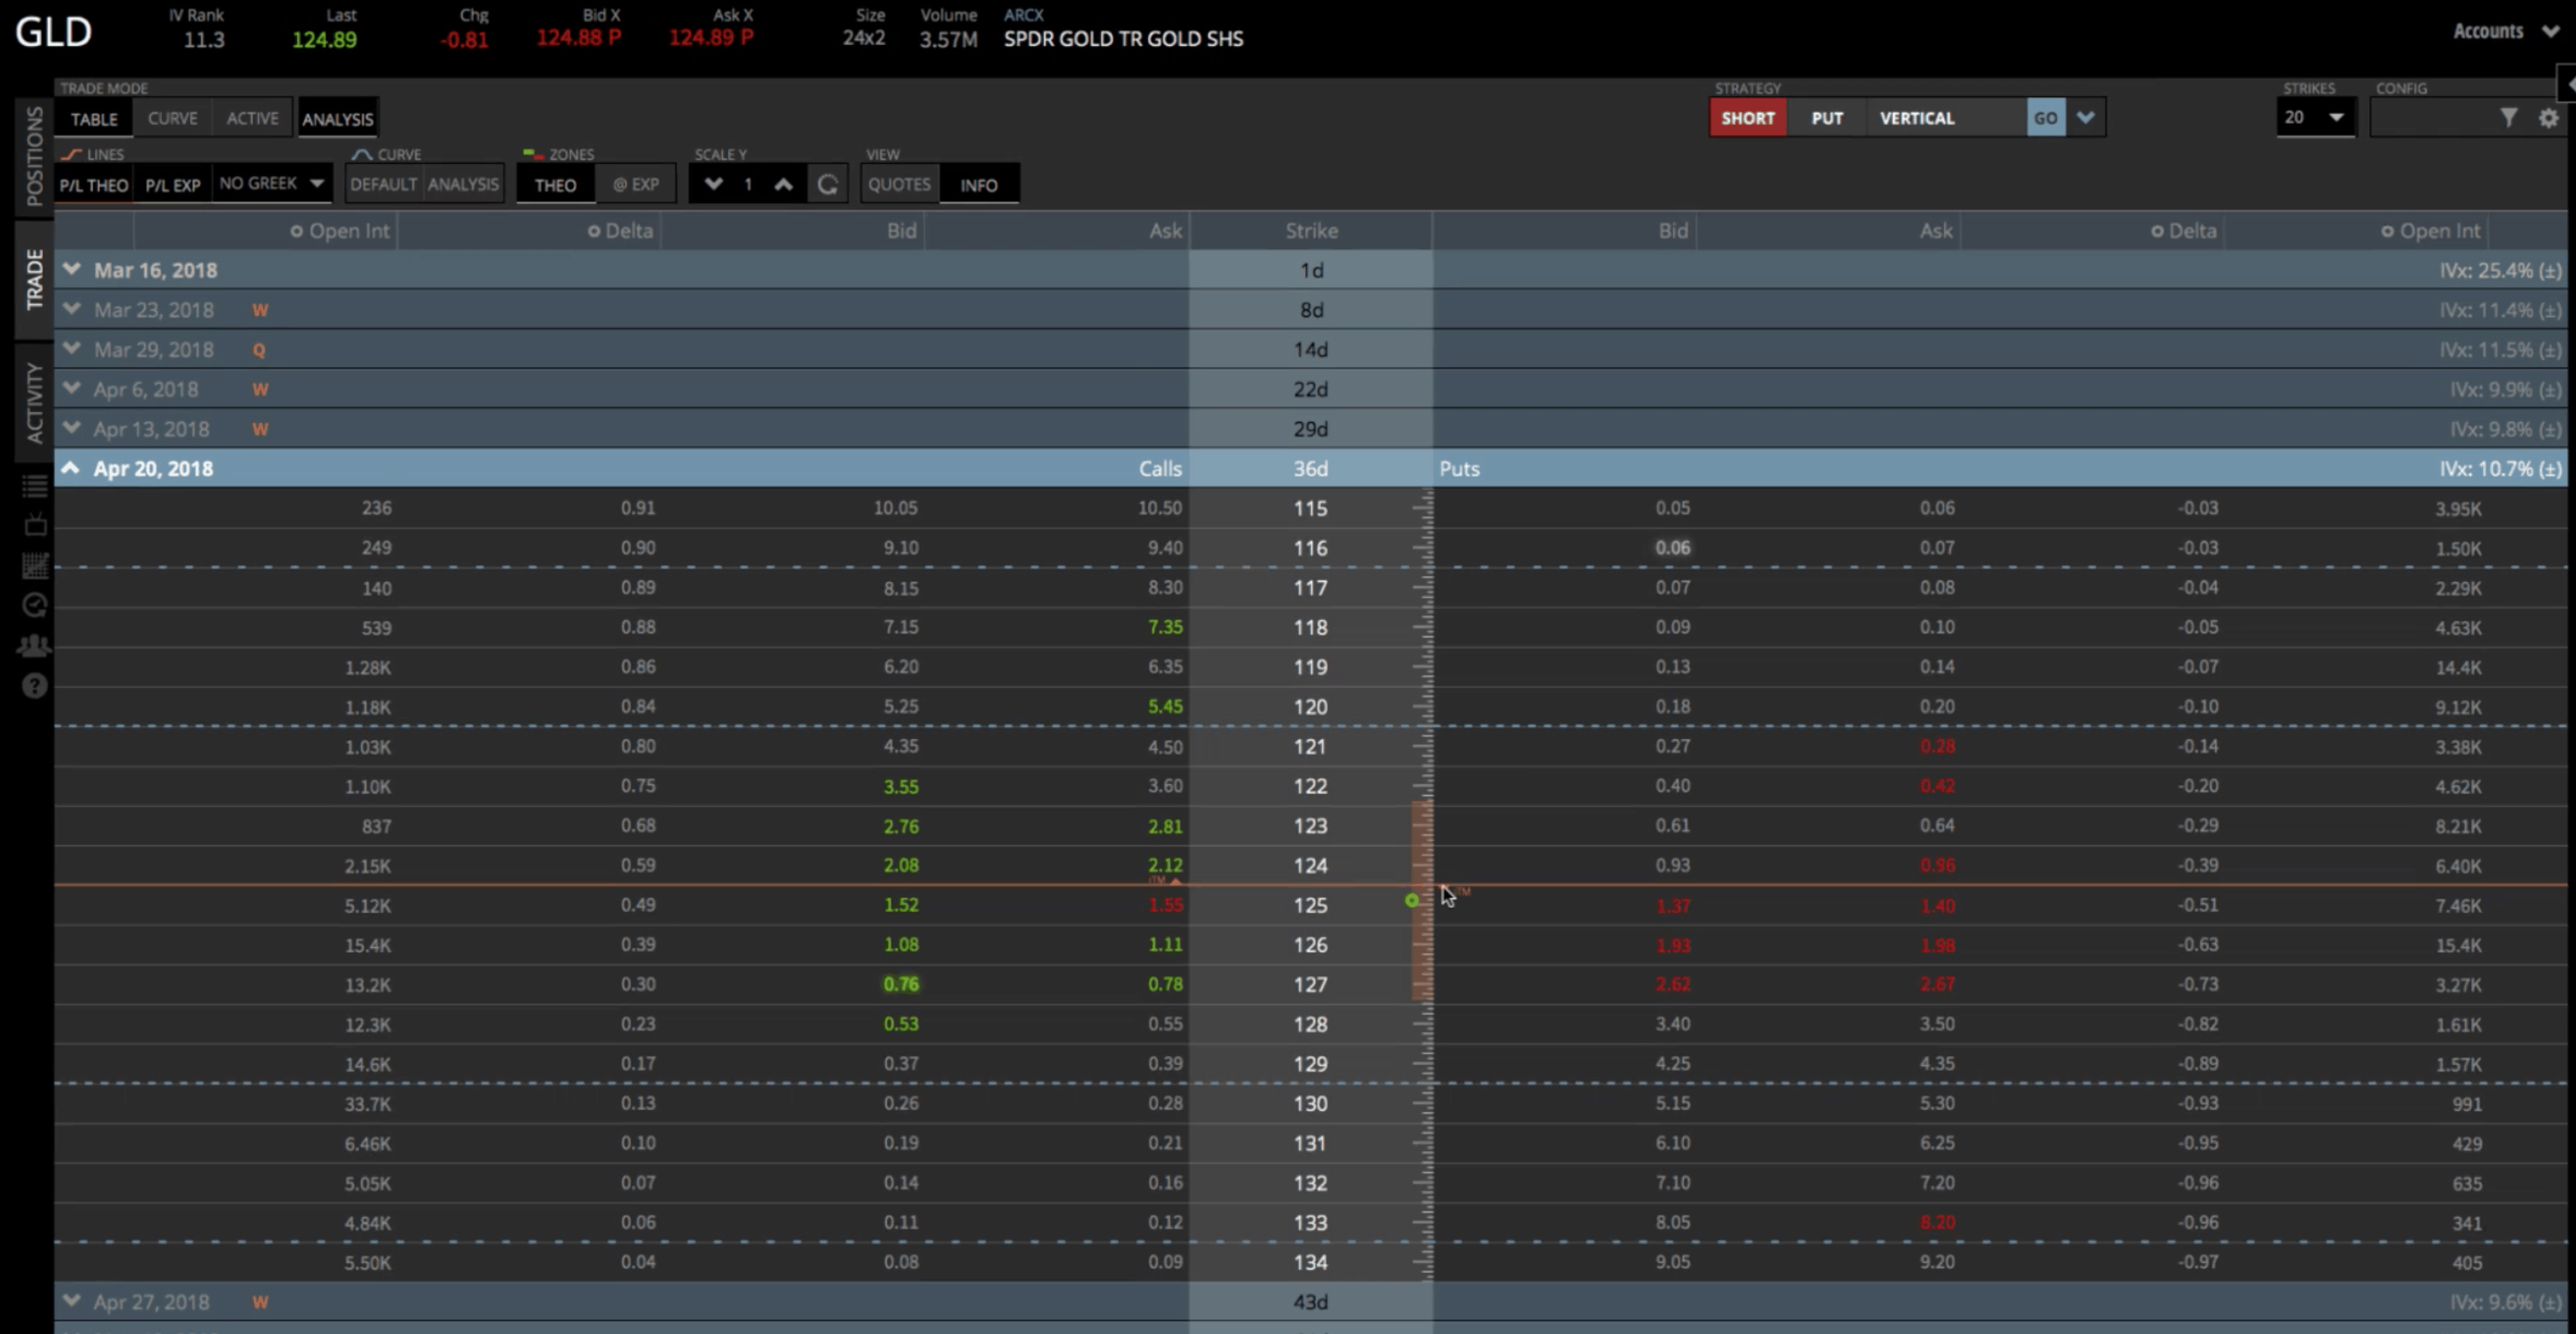

GLD’s currently trading at about $125. So, that would be the strike that we would choose.
There’s a couple different ways to put the trade on. When we are entering a Calendar, we are selling the front month (the near term month) and we’re buying options in the next cycle. So, we’re selling the front month in anticipation that it is going to decay quicker than the back month.
We’re going be selling the front month and buying the back month using the exact same strikes. In this case, the $125 strike is the one we want to sell, so go ahead and click on that.
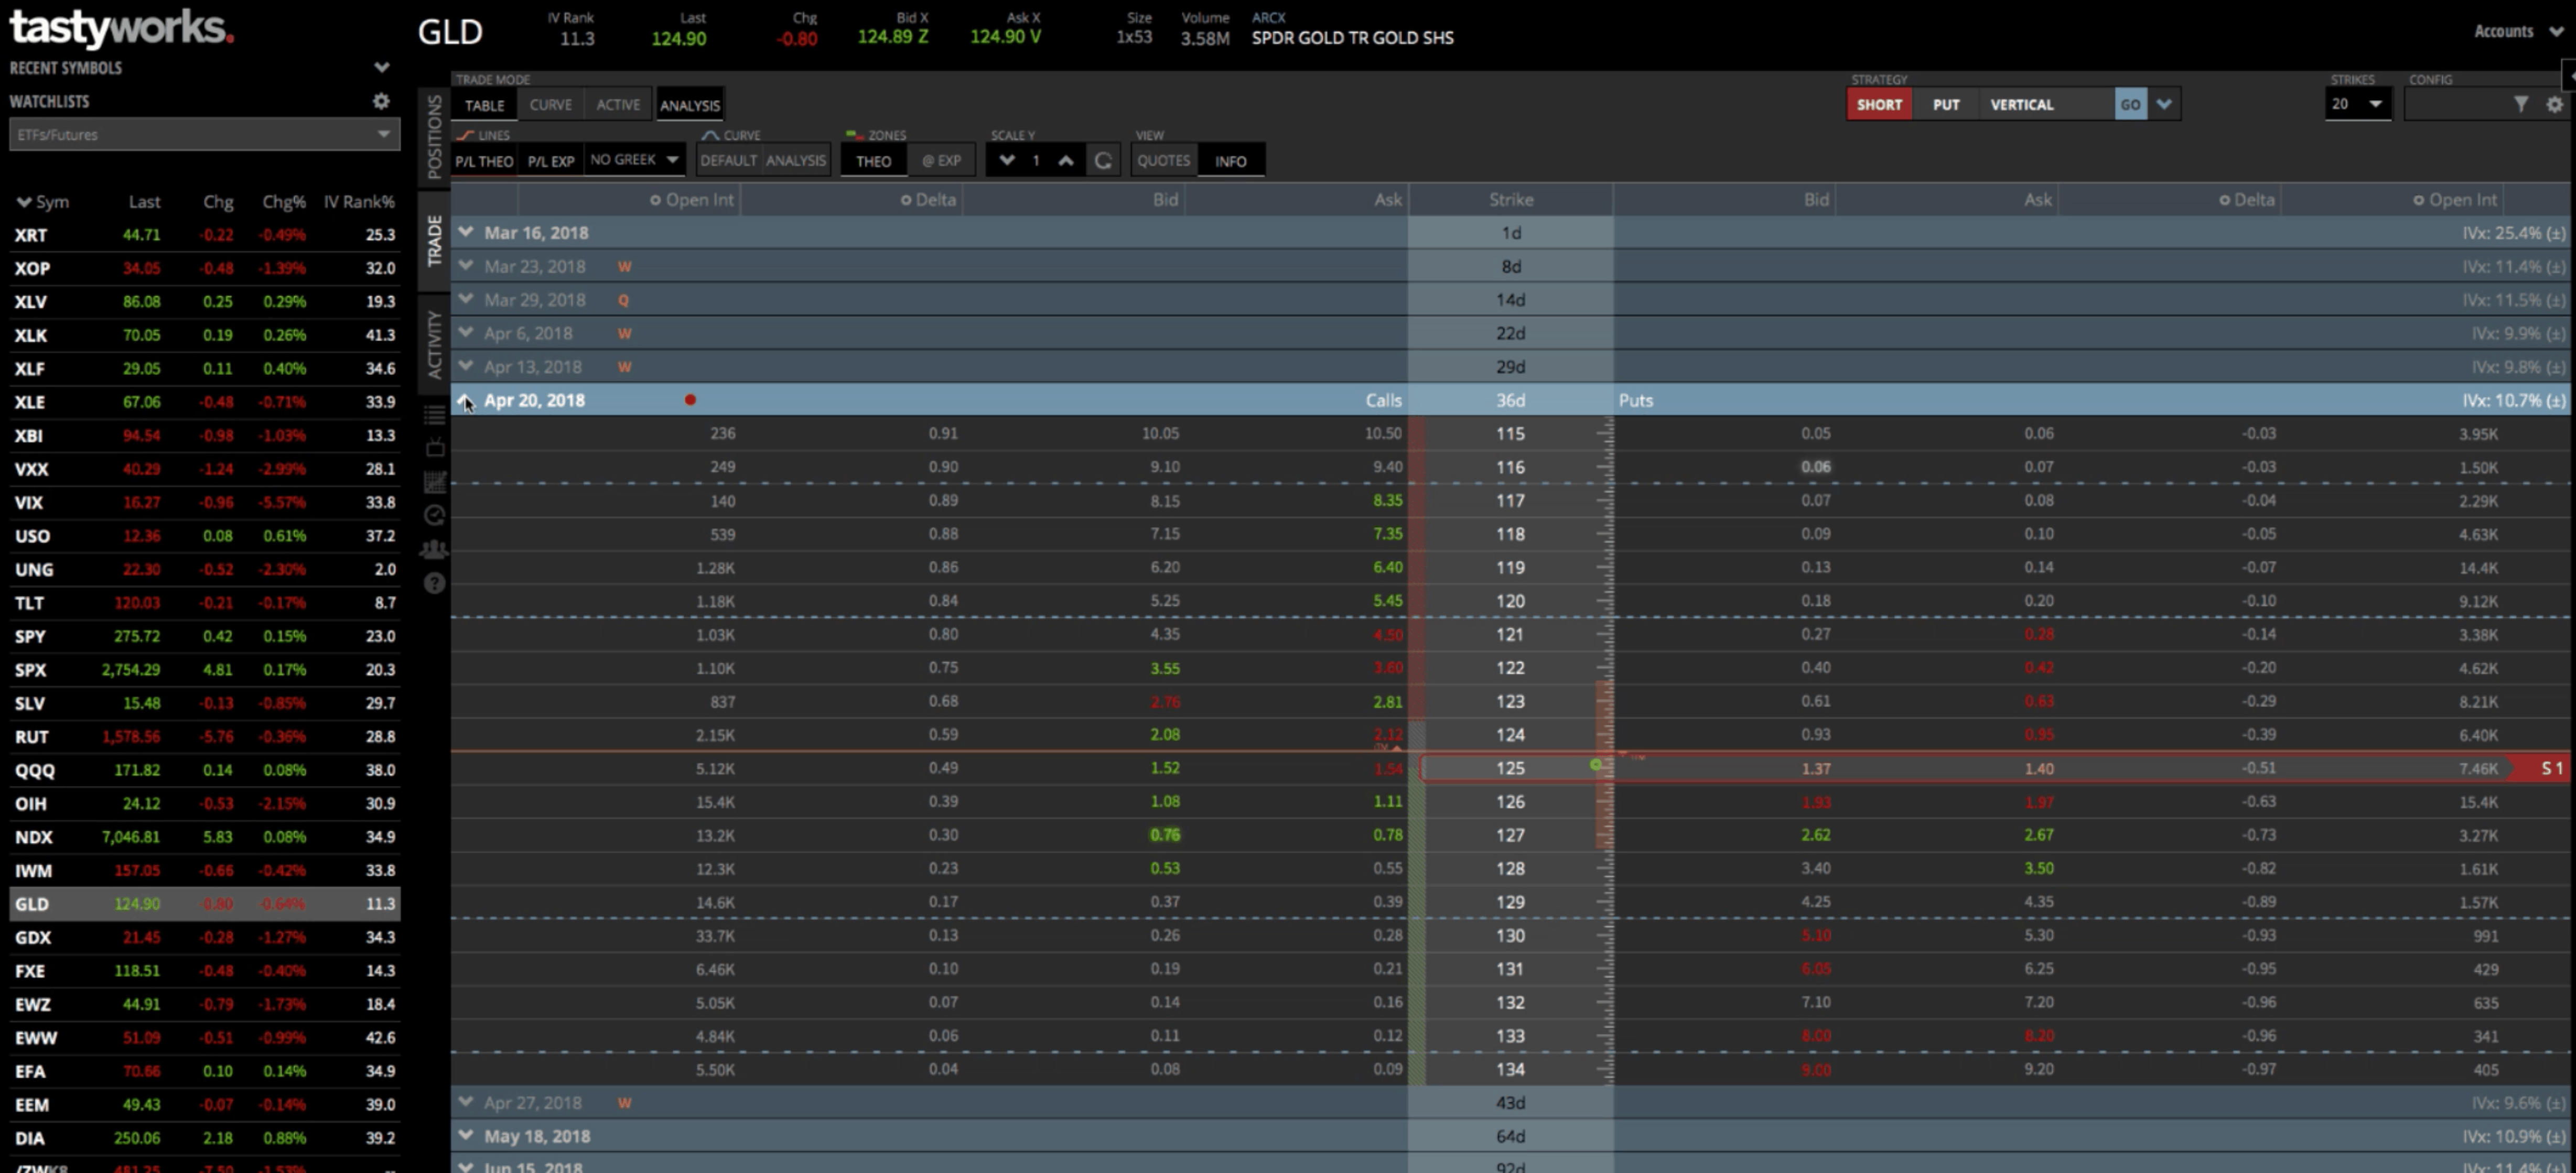

Then we can close that chain and open the next monthly cycle; which in this case, is May with 64 days. Open the May cycle. Click on the $125 ask, and then buy. That populates the Order. You can see the Order area at the bottom of the platform.

We’ve got the $125 put Calendar, but you can also do Calendars on the call side. We typically like to start on the put side. There’s not a huge difference, but there is just a little bit more efficiency over time.
You can see we’re selling the April 20th $125 put. We’re buying the May 18th $125 put, and that would be the Calendar setup.
When the option chains are closed, you can see that there’s a red dot for sell, and a green dot for buy. By looking at this, you can see how you’ve set up your Calendar Spread as well.

Strategy Dropdown
Another option is the Strategy drop down. Make sure you clear your previous position. When you use the Strategy drop down, make sure you toggle to “Long”, because on a Calendar Spread, we are buying it to open. Next, toggle to Put or Call, whichever one you decide to use. In our case, we want to toggle to “Put”. From the drop down, choose “Calendar”. By hitting “Go”, that’ll automatically put the calendar into your platform.
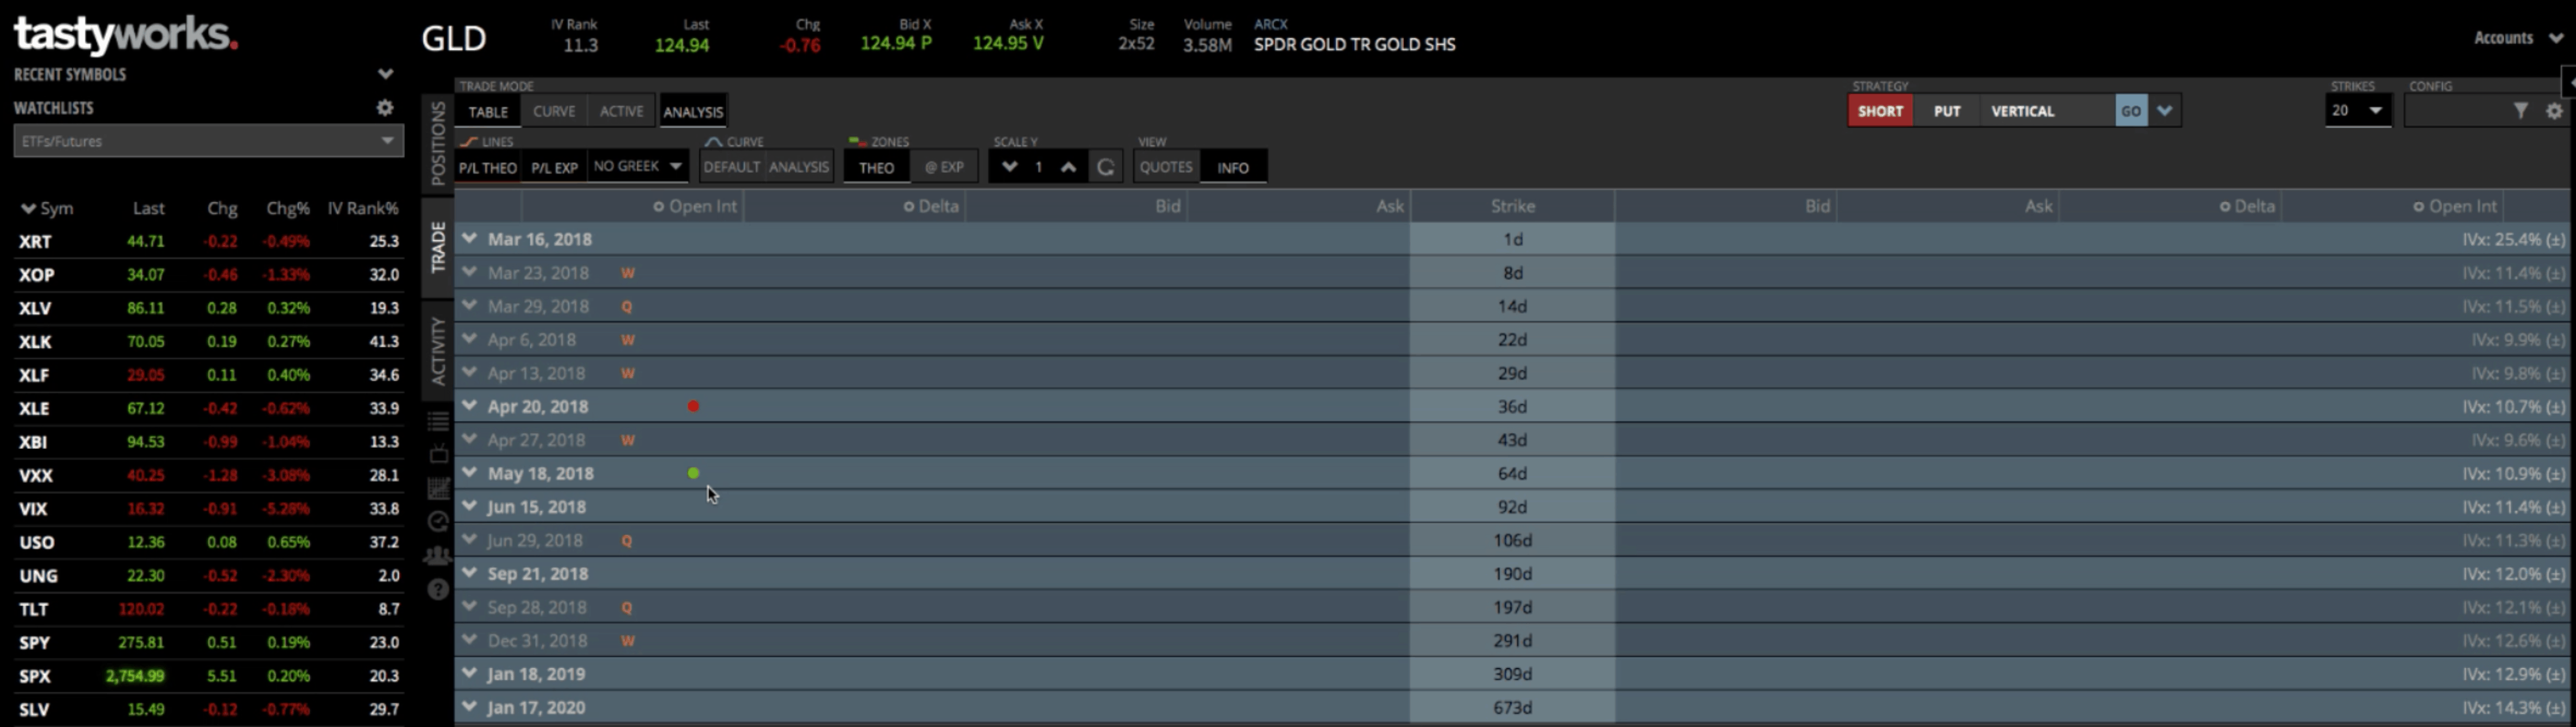
Here’s the problem with the strategy drop-down method: it doesn’t automatically populate to the monthly expirations. You can see we’re in a weekly one with 22 days, and then the further out we’re buying with 43 days. That’s NOT what we want.

You can utilize the expirations button down at the bottom of the platform and push this further out in time. We can get it so that the monthly is the one we sell; however, the long ones that are being bought are too far out. Ninety-two days out is too far. We would want to be in the 64 days to expiration. Utilizing the expirations button is going to set the strikes on the correct expiration cycles with some symbols. But in this case, the expirations button and the Strategy Drop Down aren’t working how we would want them to.
We’d really have to revert back to the first method I showed you, which is manually just going in and clicking on the strikes that you want in each expiration cycle.
Calendar Spreads Are A Different Kind Of Animal
Calendars are a different animal, because most trades that we put on, the strikes and all the options are within one expiration cycle. With a calendar, we’re utilizing options in two separate expirations. The platform is not set up to enter it that way and so we’ll have to do it manually.
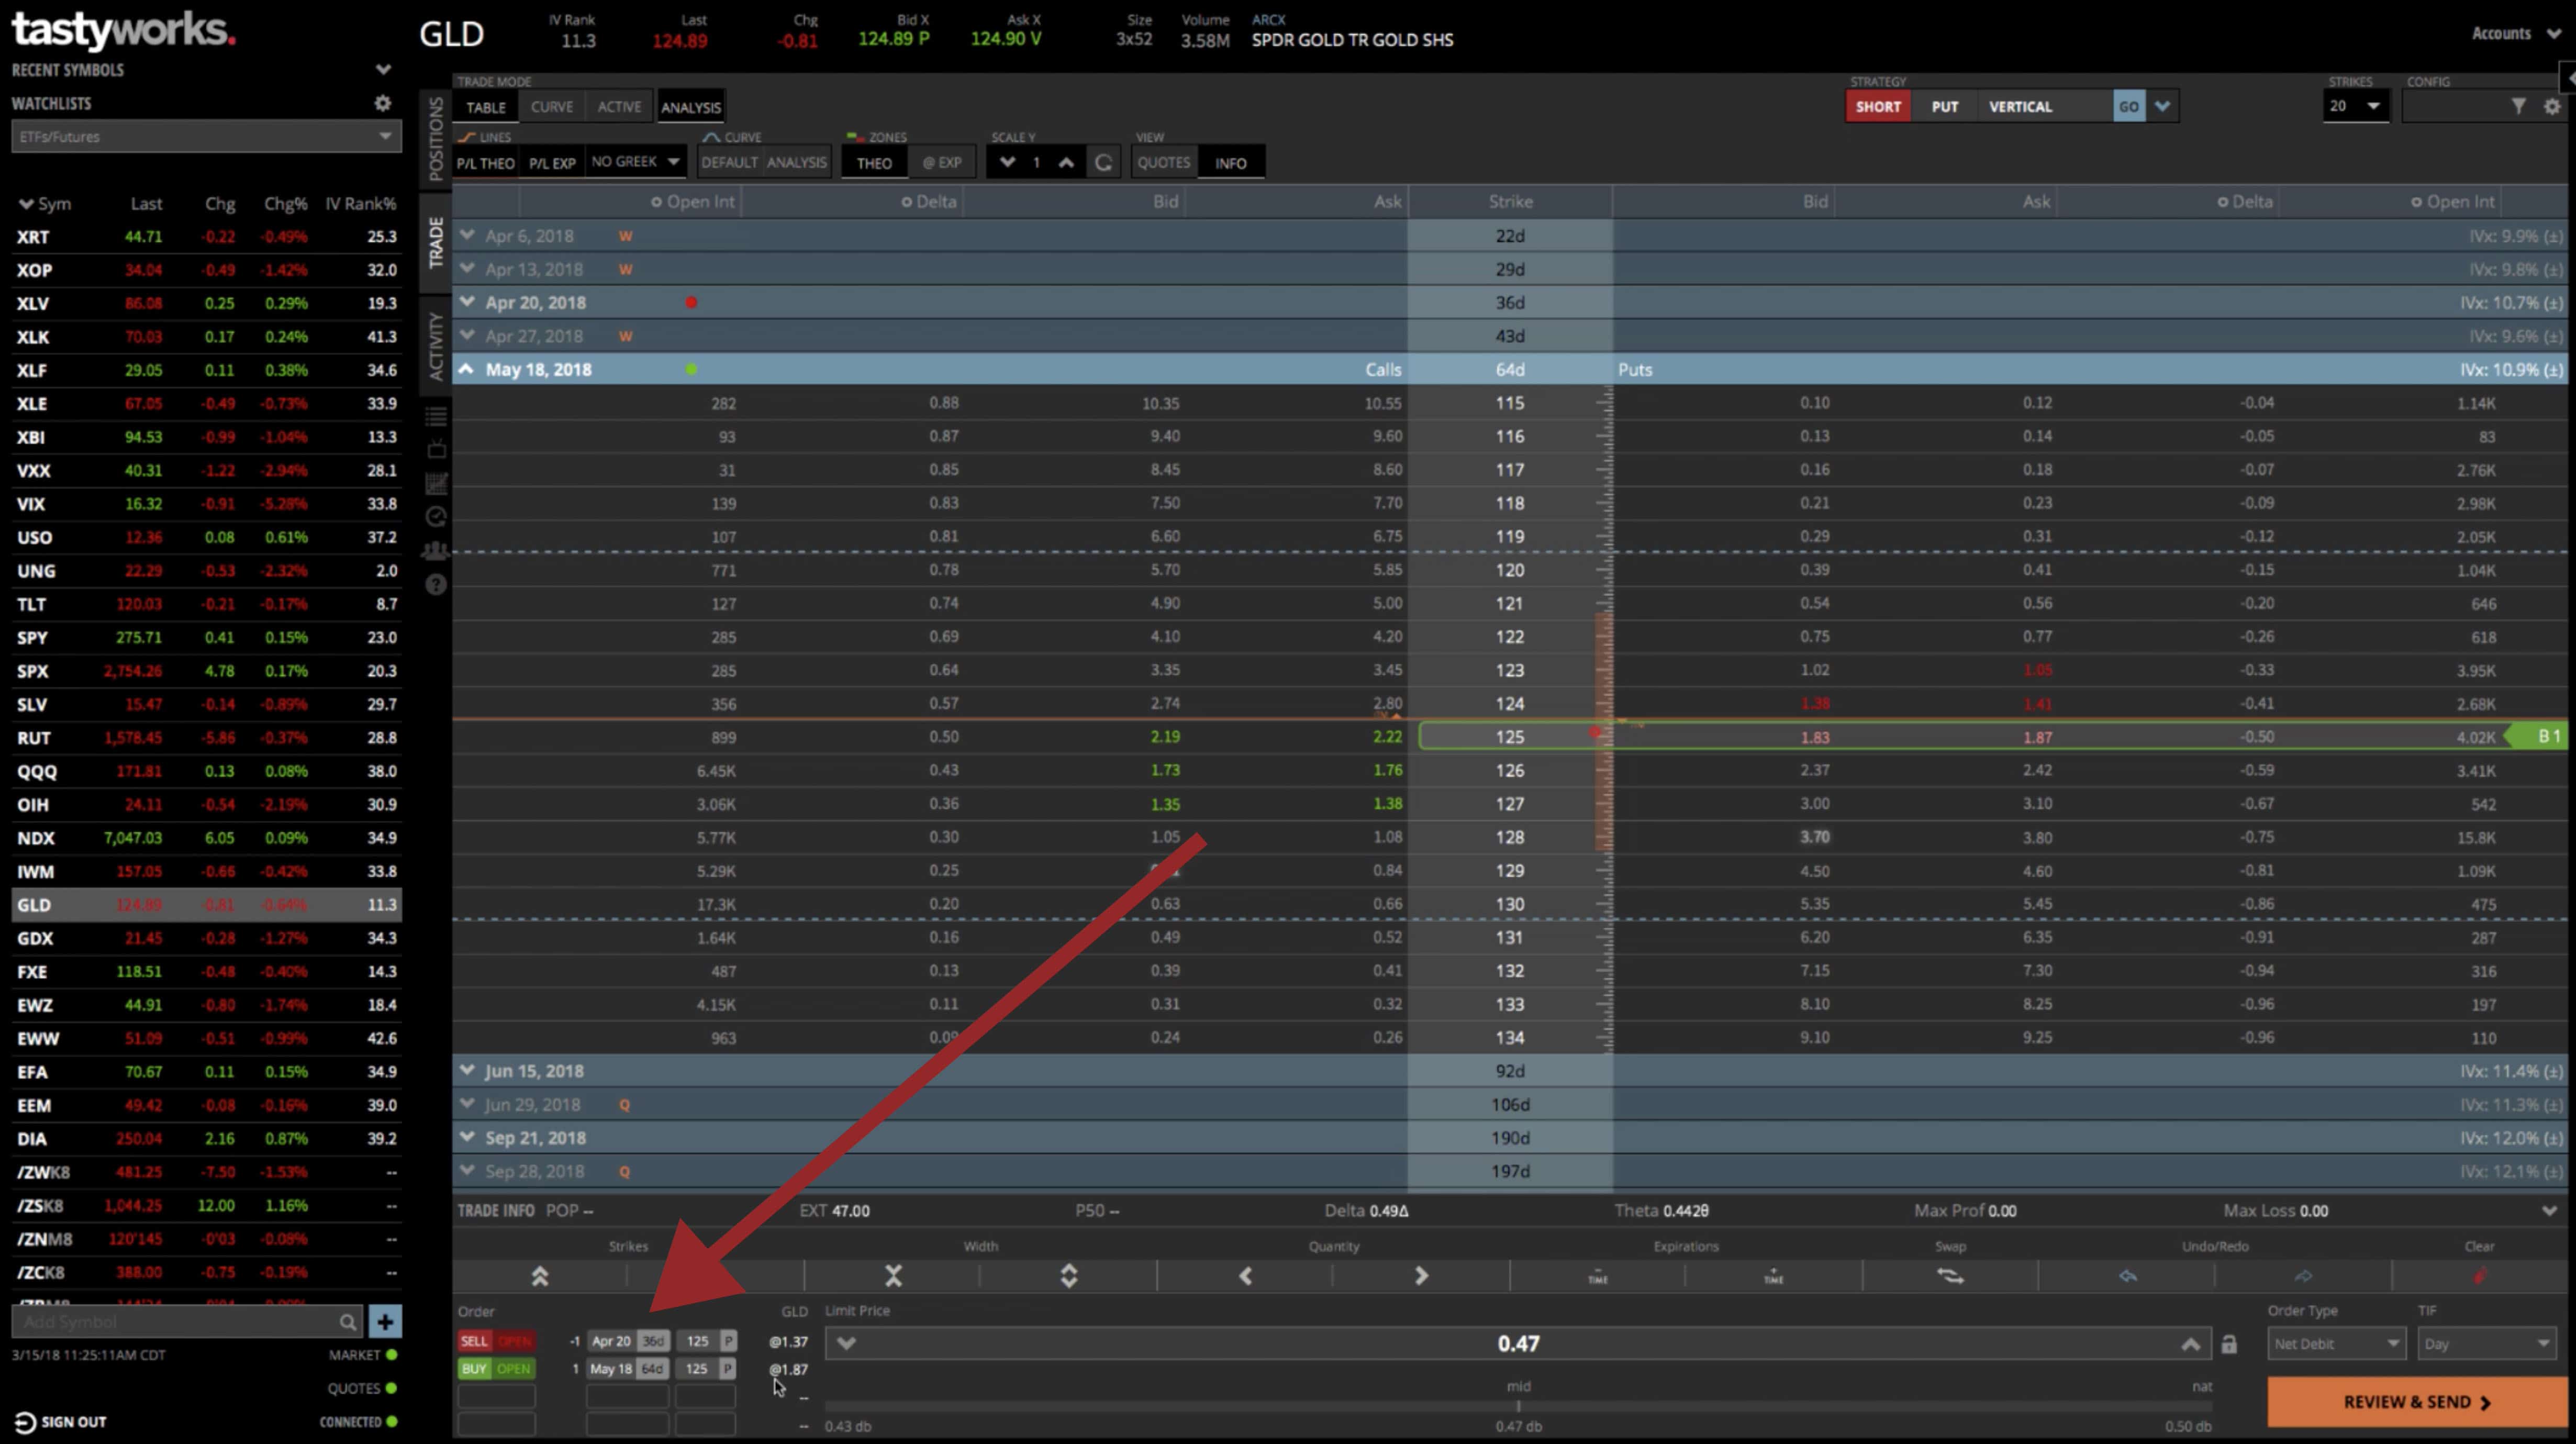
Let’s go back and do this manually. We want the $125, that’s the one we’re selling. Then, if we go out to the June cycle, let’s just go ahead and delete that leg. Then we can go back into May 18th, which is the cycle that we want, and buy the $125 by clicking on it. You do have to manually go in and do that.
Then you can double-check it down in the Order area at the bottom of the platform. So we’re selling the April 20th with 36 days. We’re buying the May 18th, with 64 days. Both of those are on the $125 put, which is the one we want.
Click on the “Curve” tab up at the top of the platform, making sure the “Analysis” tab is selected as well. This will populate a graphic picture of the trade. You can make this smaller or a little bit bigger, and you can see the green represents where you are making money; the red would represent where you are losing money.
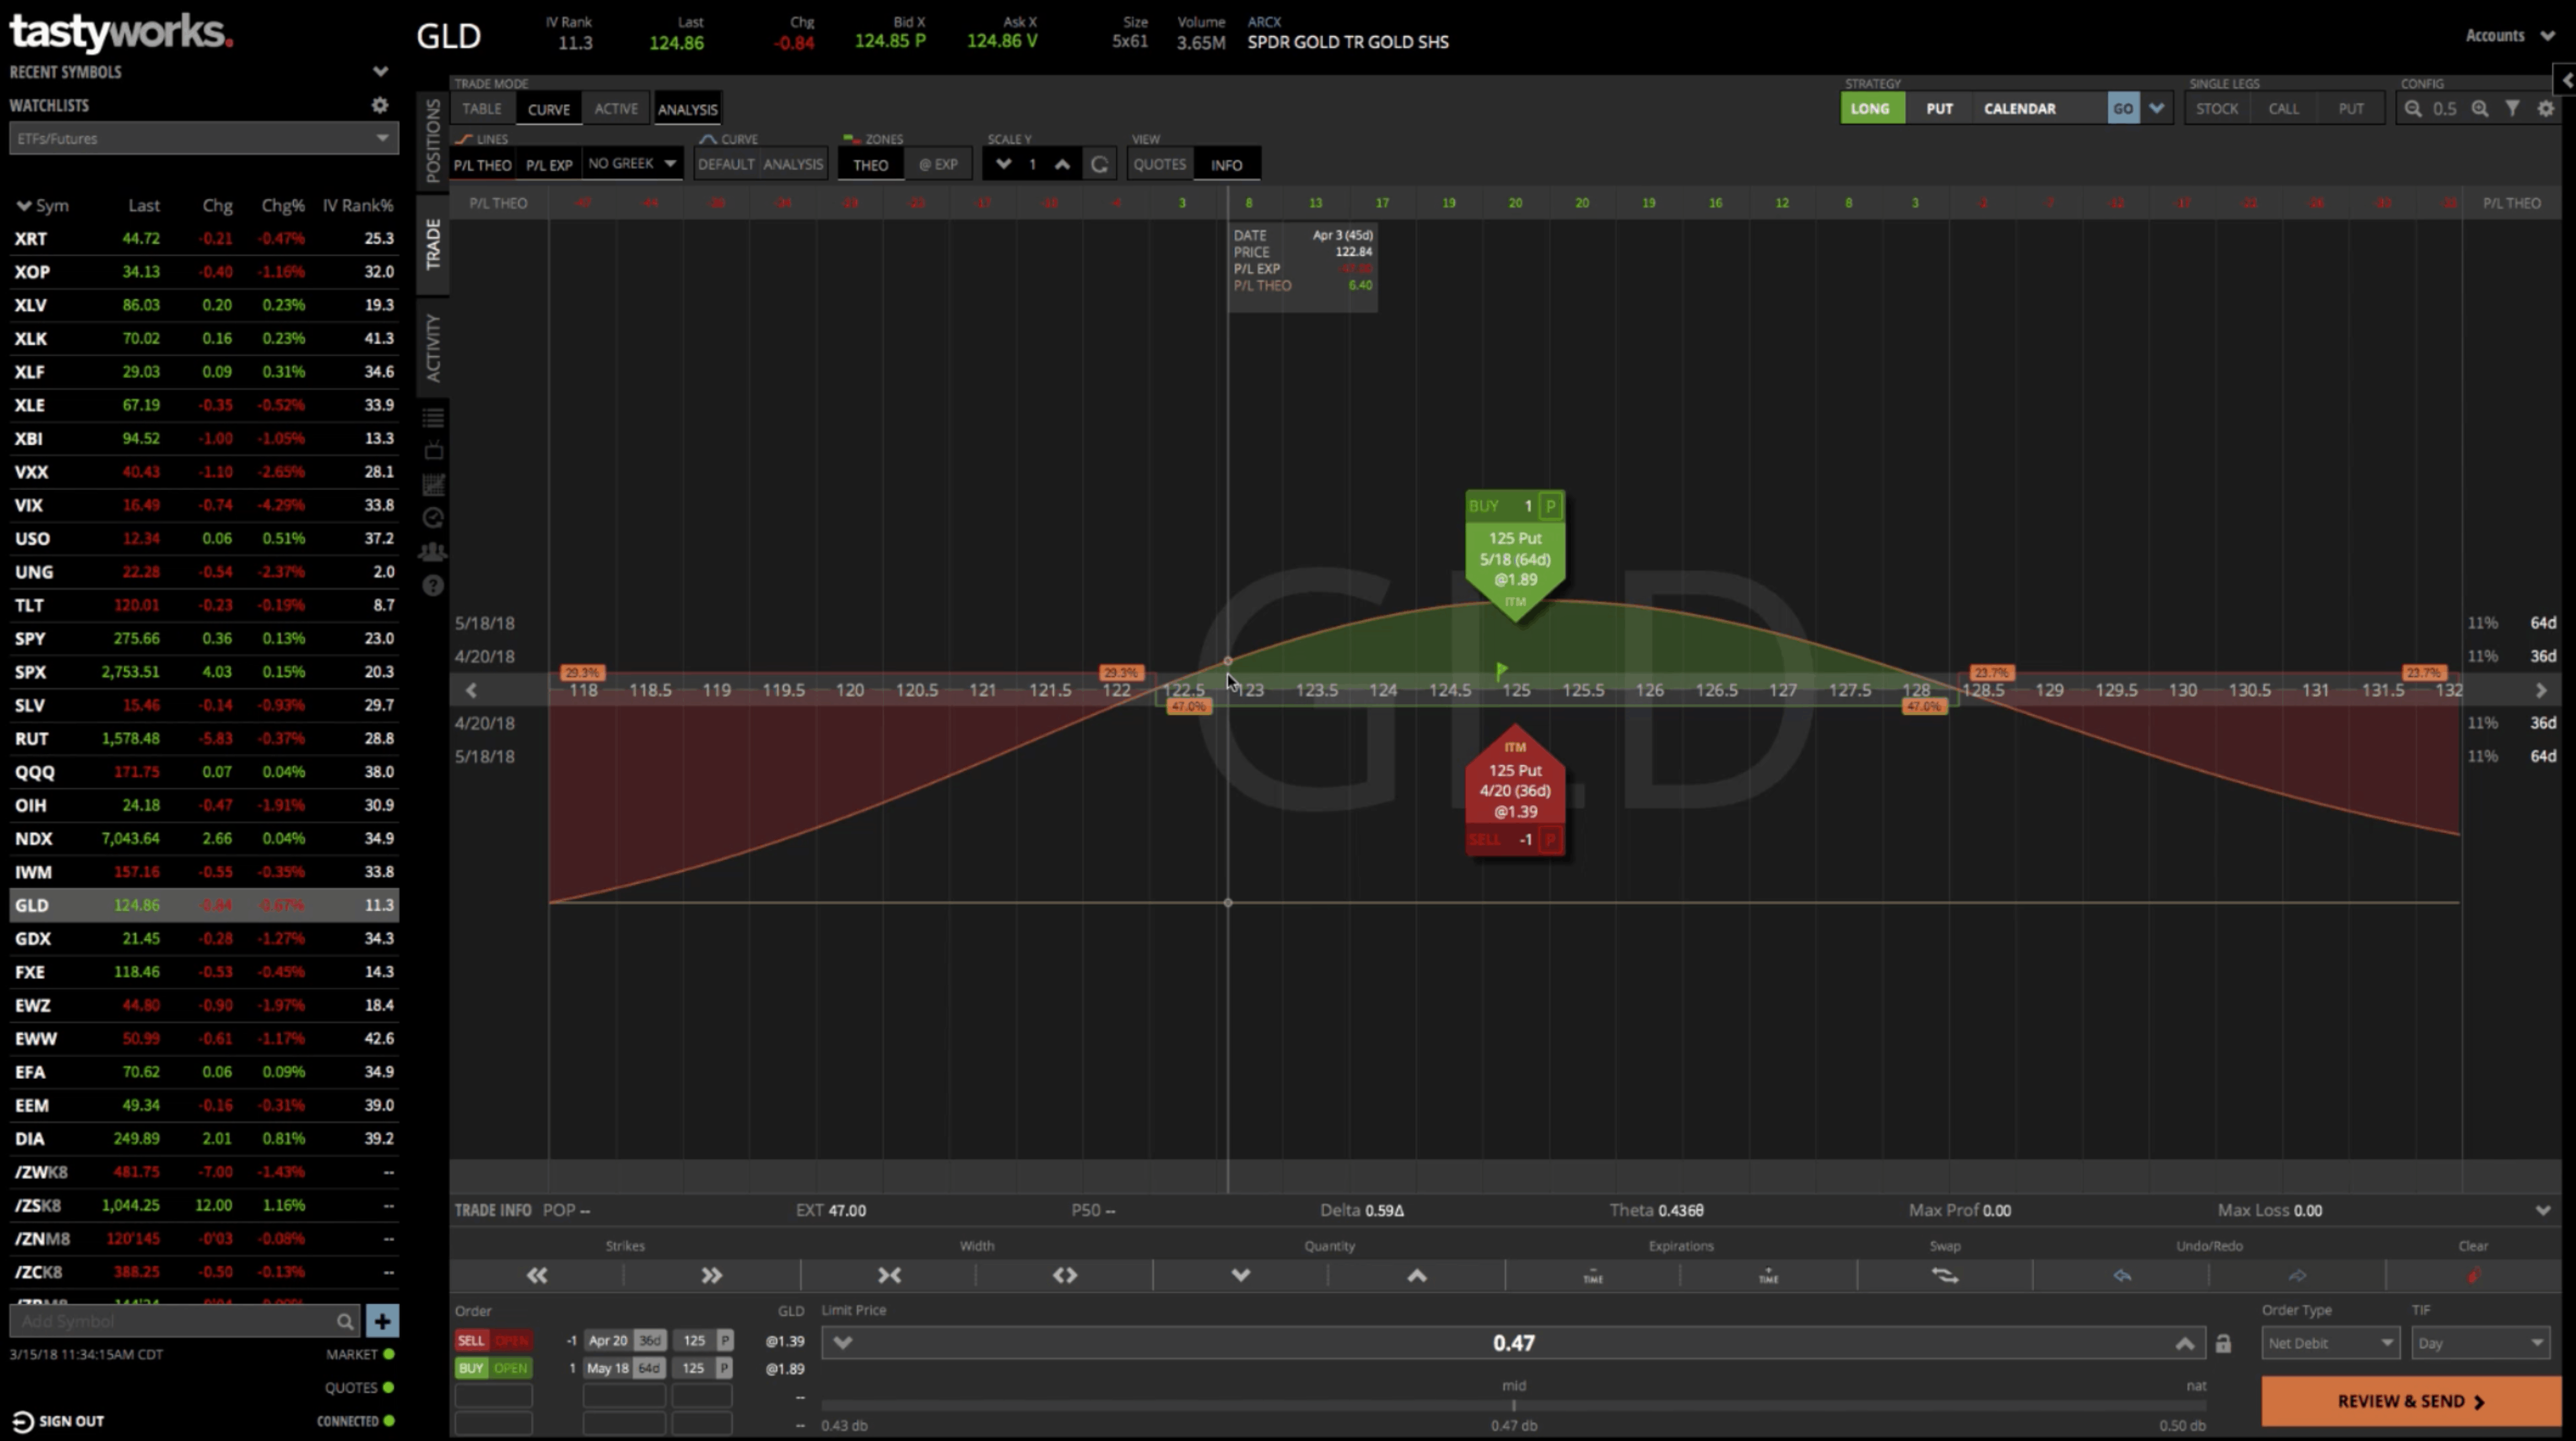

Keep in mind, the statistics down below don’t populate as far as the probability of profit. This is because with a Calendar, you are utilizing two different expiration cycles. So the P50 and the POP are not going to populate. So, you really just need to get an idea of if this trade makes sense based on where the break-evens are, and based on your max profit. You can utilize the flag. It shows the P/L at expiration is $46 in this case with just one contract.
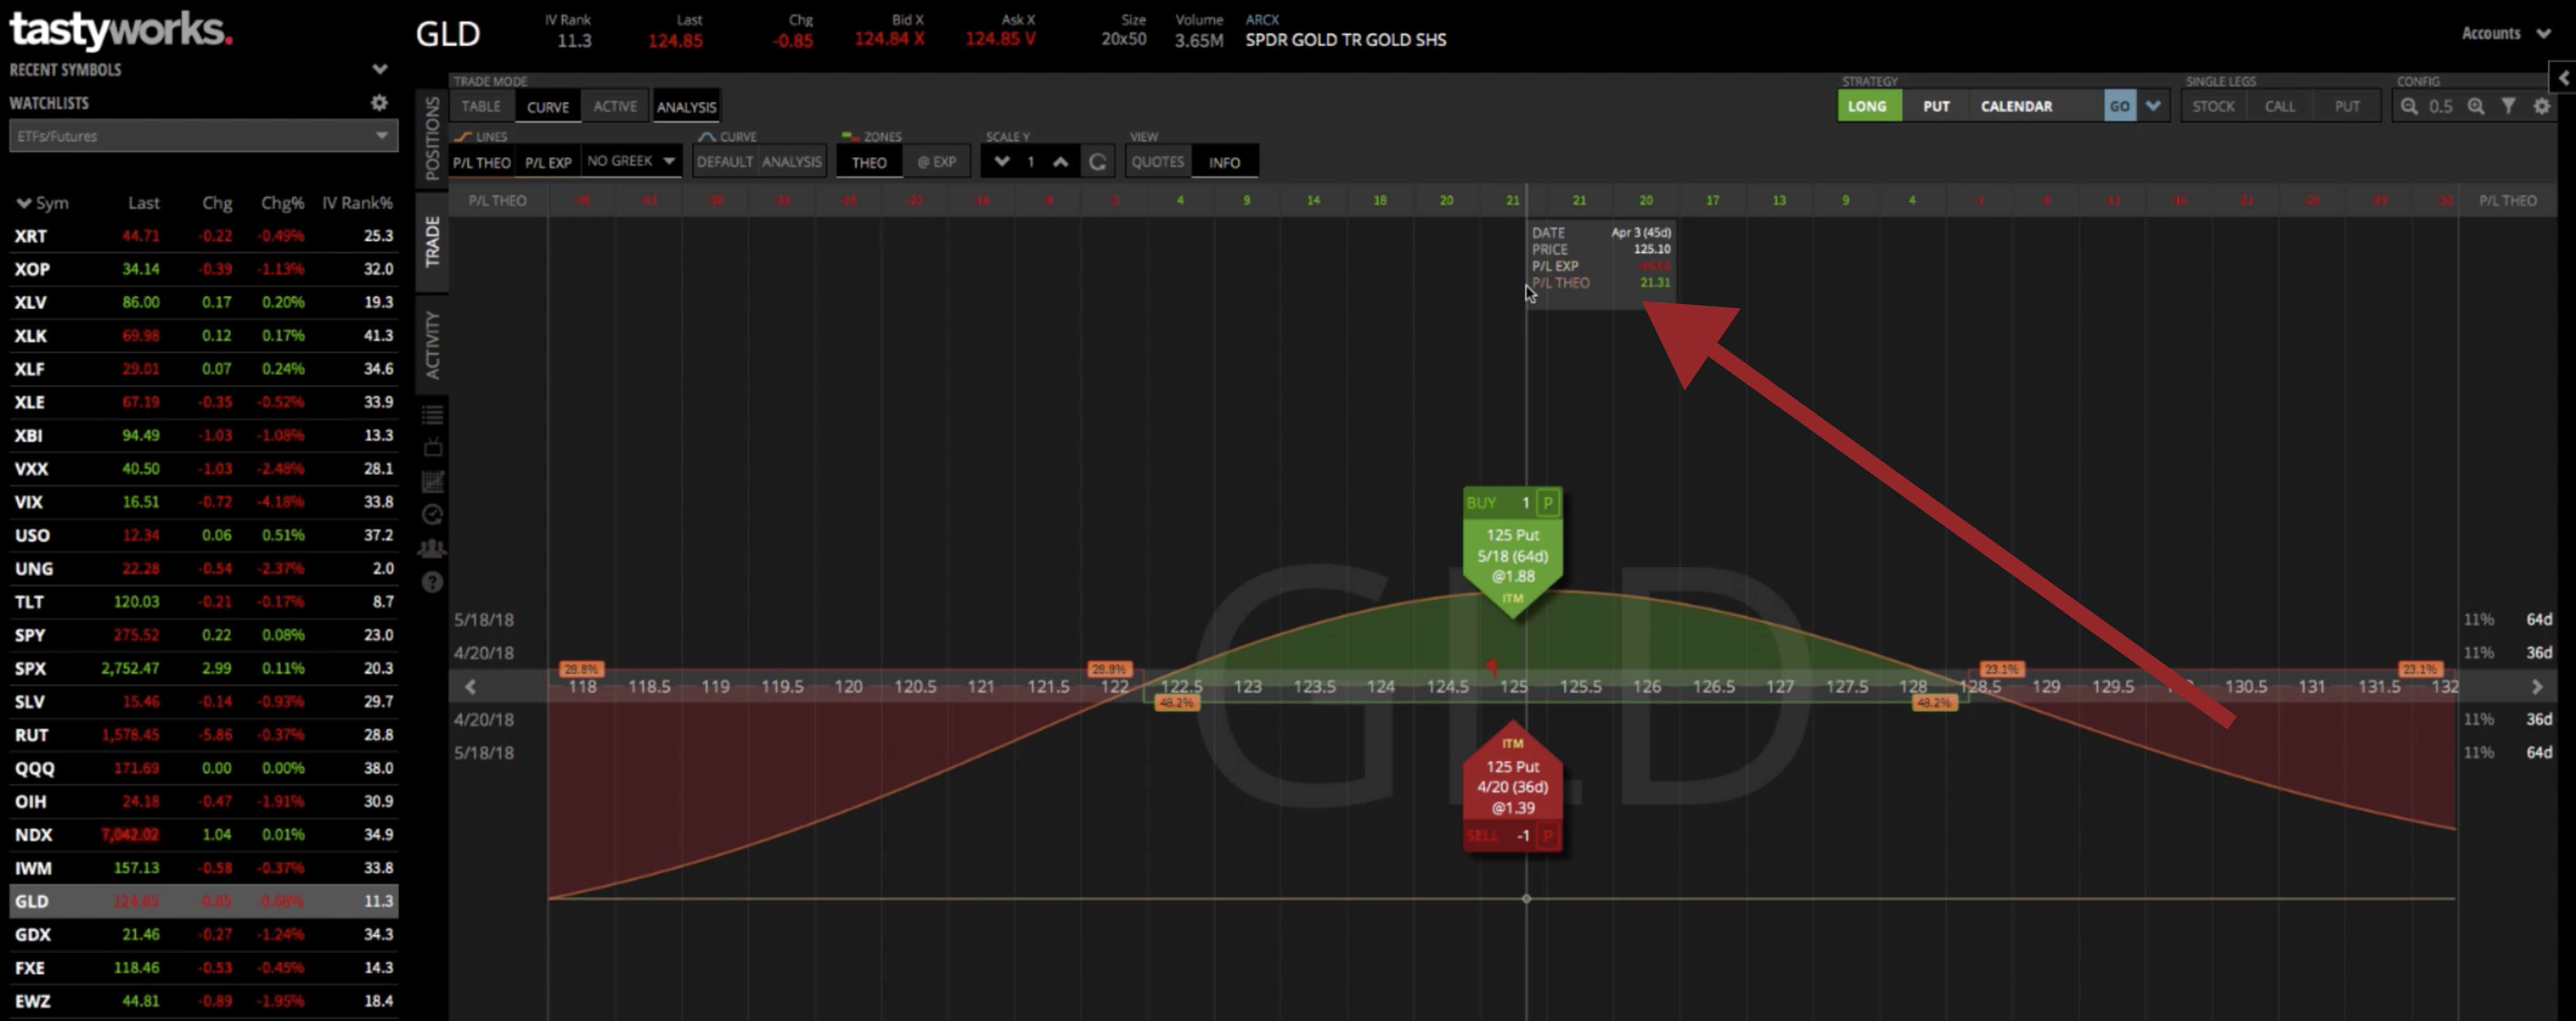

You can also open up the theoreticals. If you move the implied volatility through time (you can do that with both the front month and the back month), you can kind of see how that affects the trade. It’s a little bit odd with Calendars. Like I mentioned earlier, they’re a different animal with two different expirations.
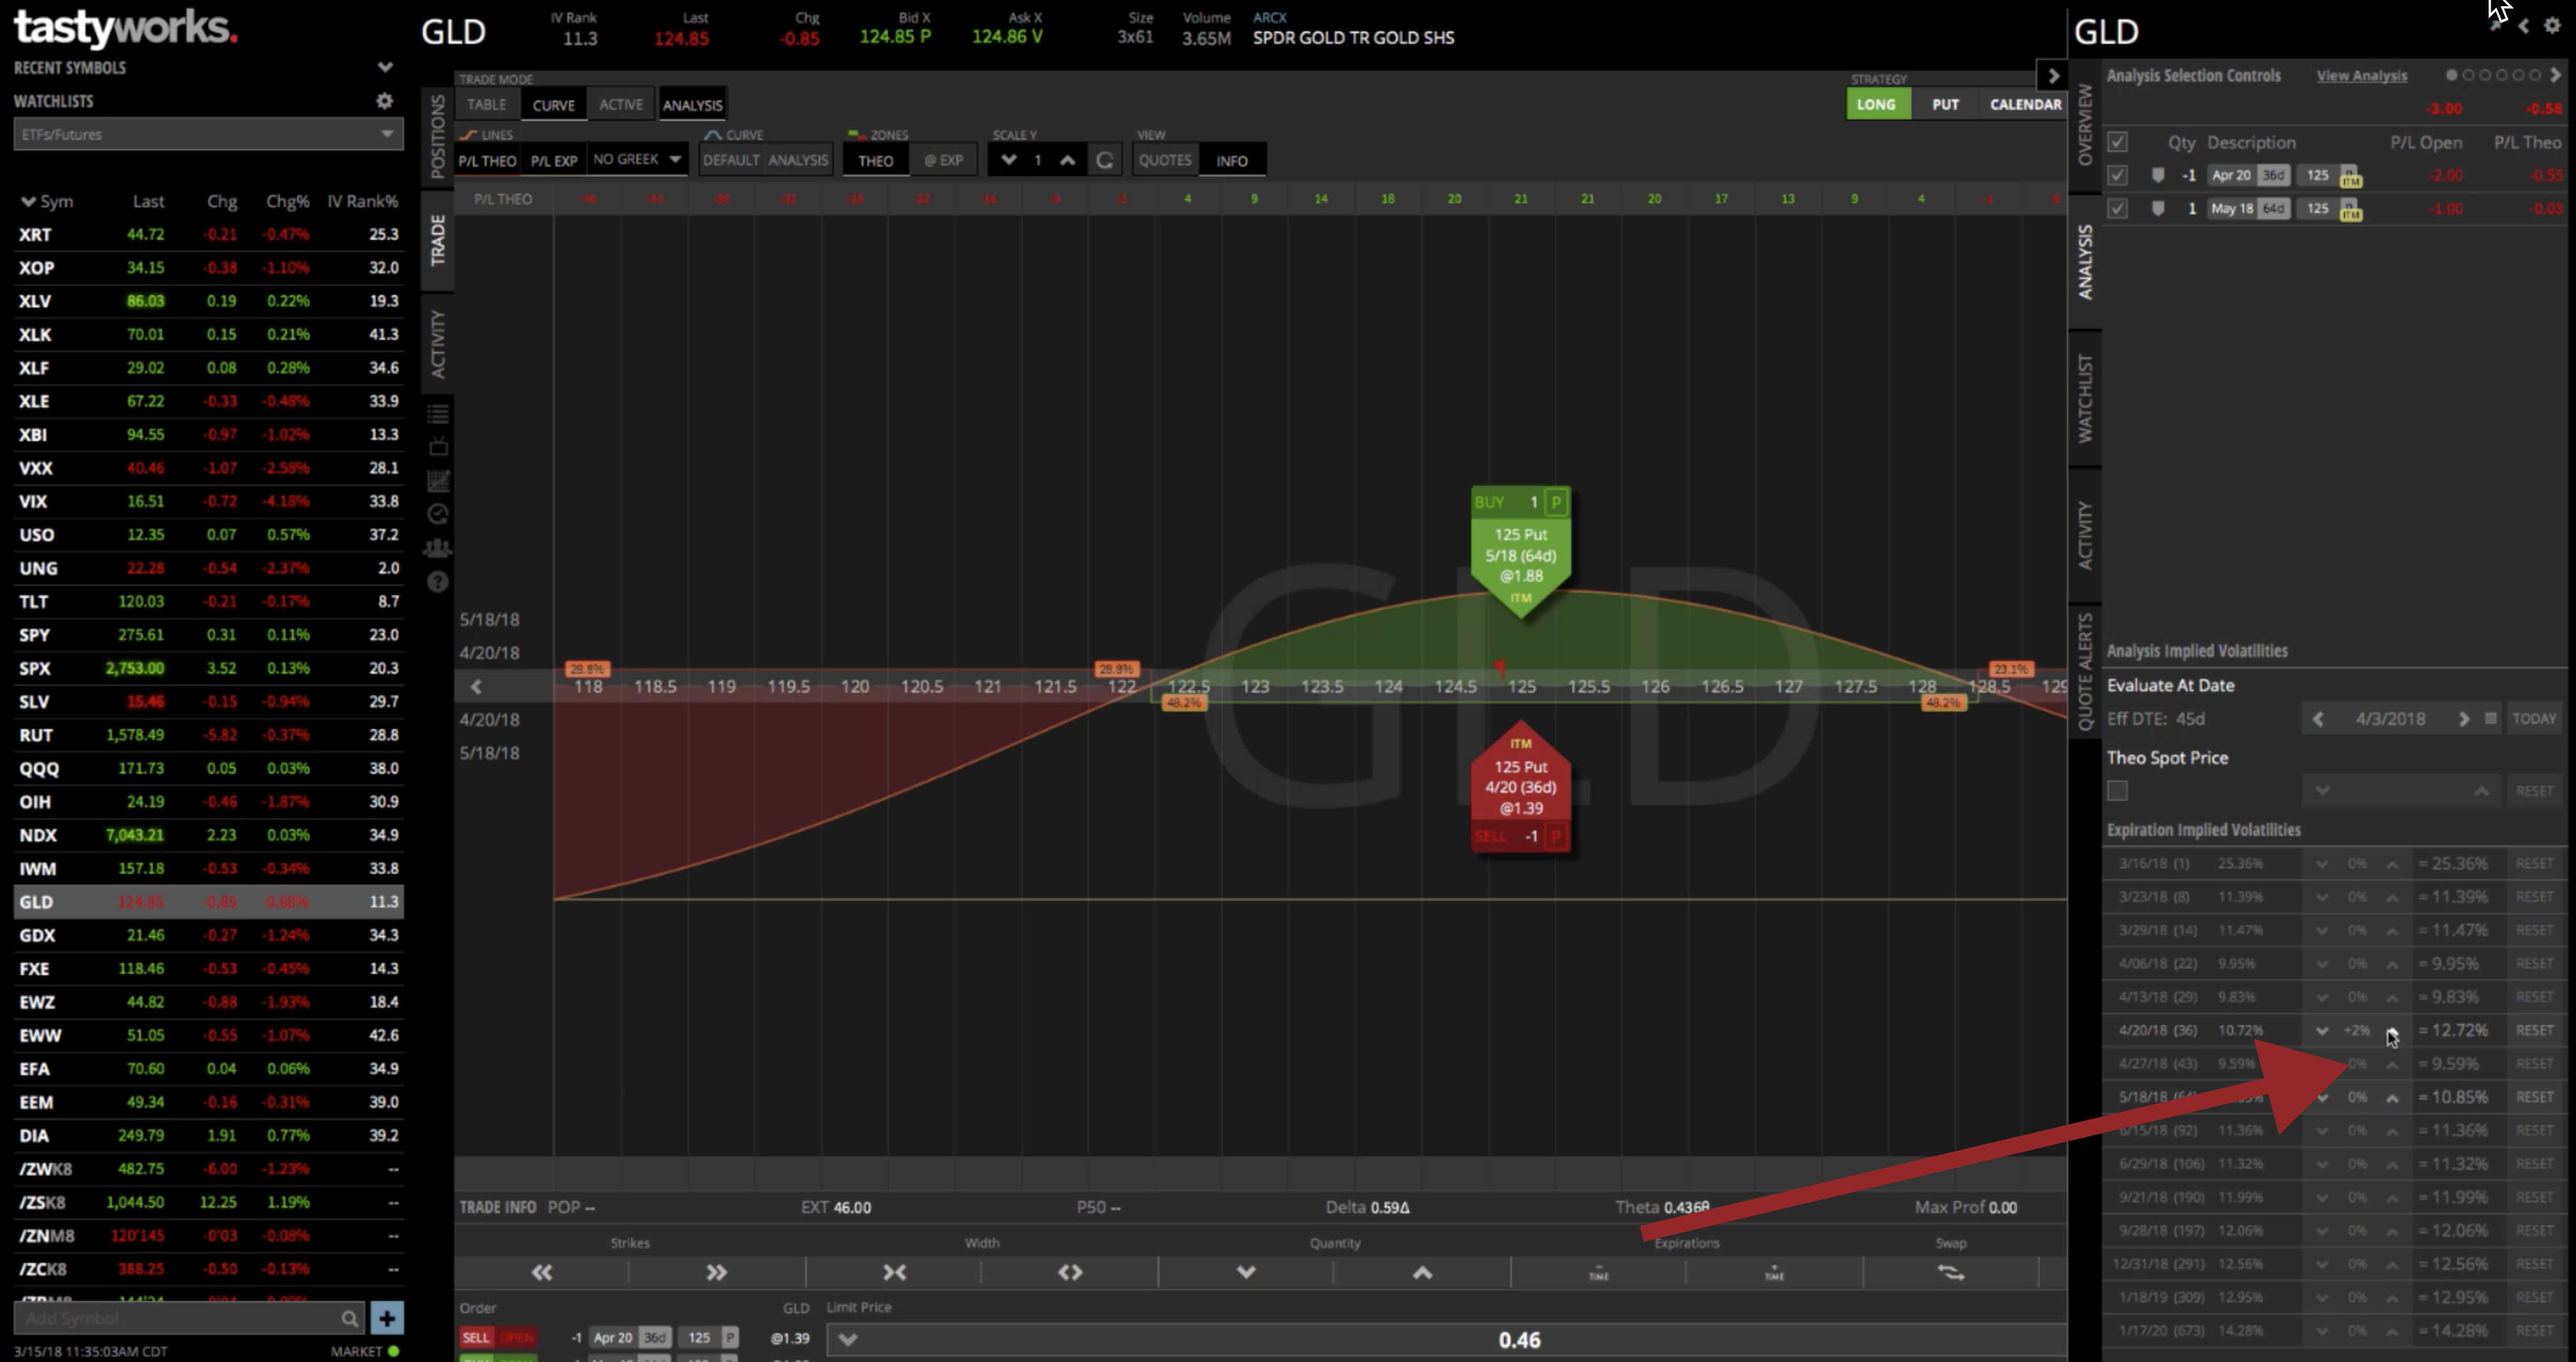

You can play around with the expirations to get an idea of where your profit will be. If you move through time, you can see how that affects it as well. With a Calendar, the way I explain it, it’s kind of like an accordion. It can expand and contract, so your break-evens aren’t set like they would be with an Iron Condor or some type of spread that utilizes just one option expiration.
If you close the theoreticals, and you’re happy with what you’re looking at, you can hit “Review and send”, and shoot it into the broker to get filled.
I hope this was helpful in explaining how to put on a Calendar Spread in the tastyworks platform!

Follow