
What’s up Navigation Traders?!
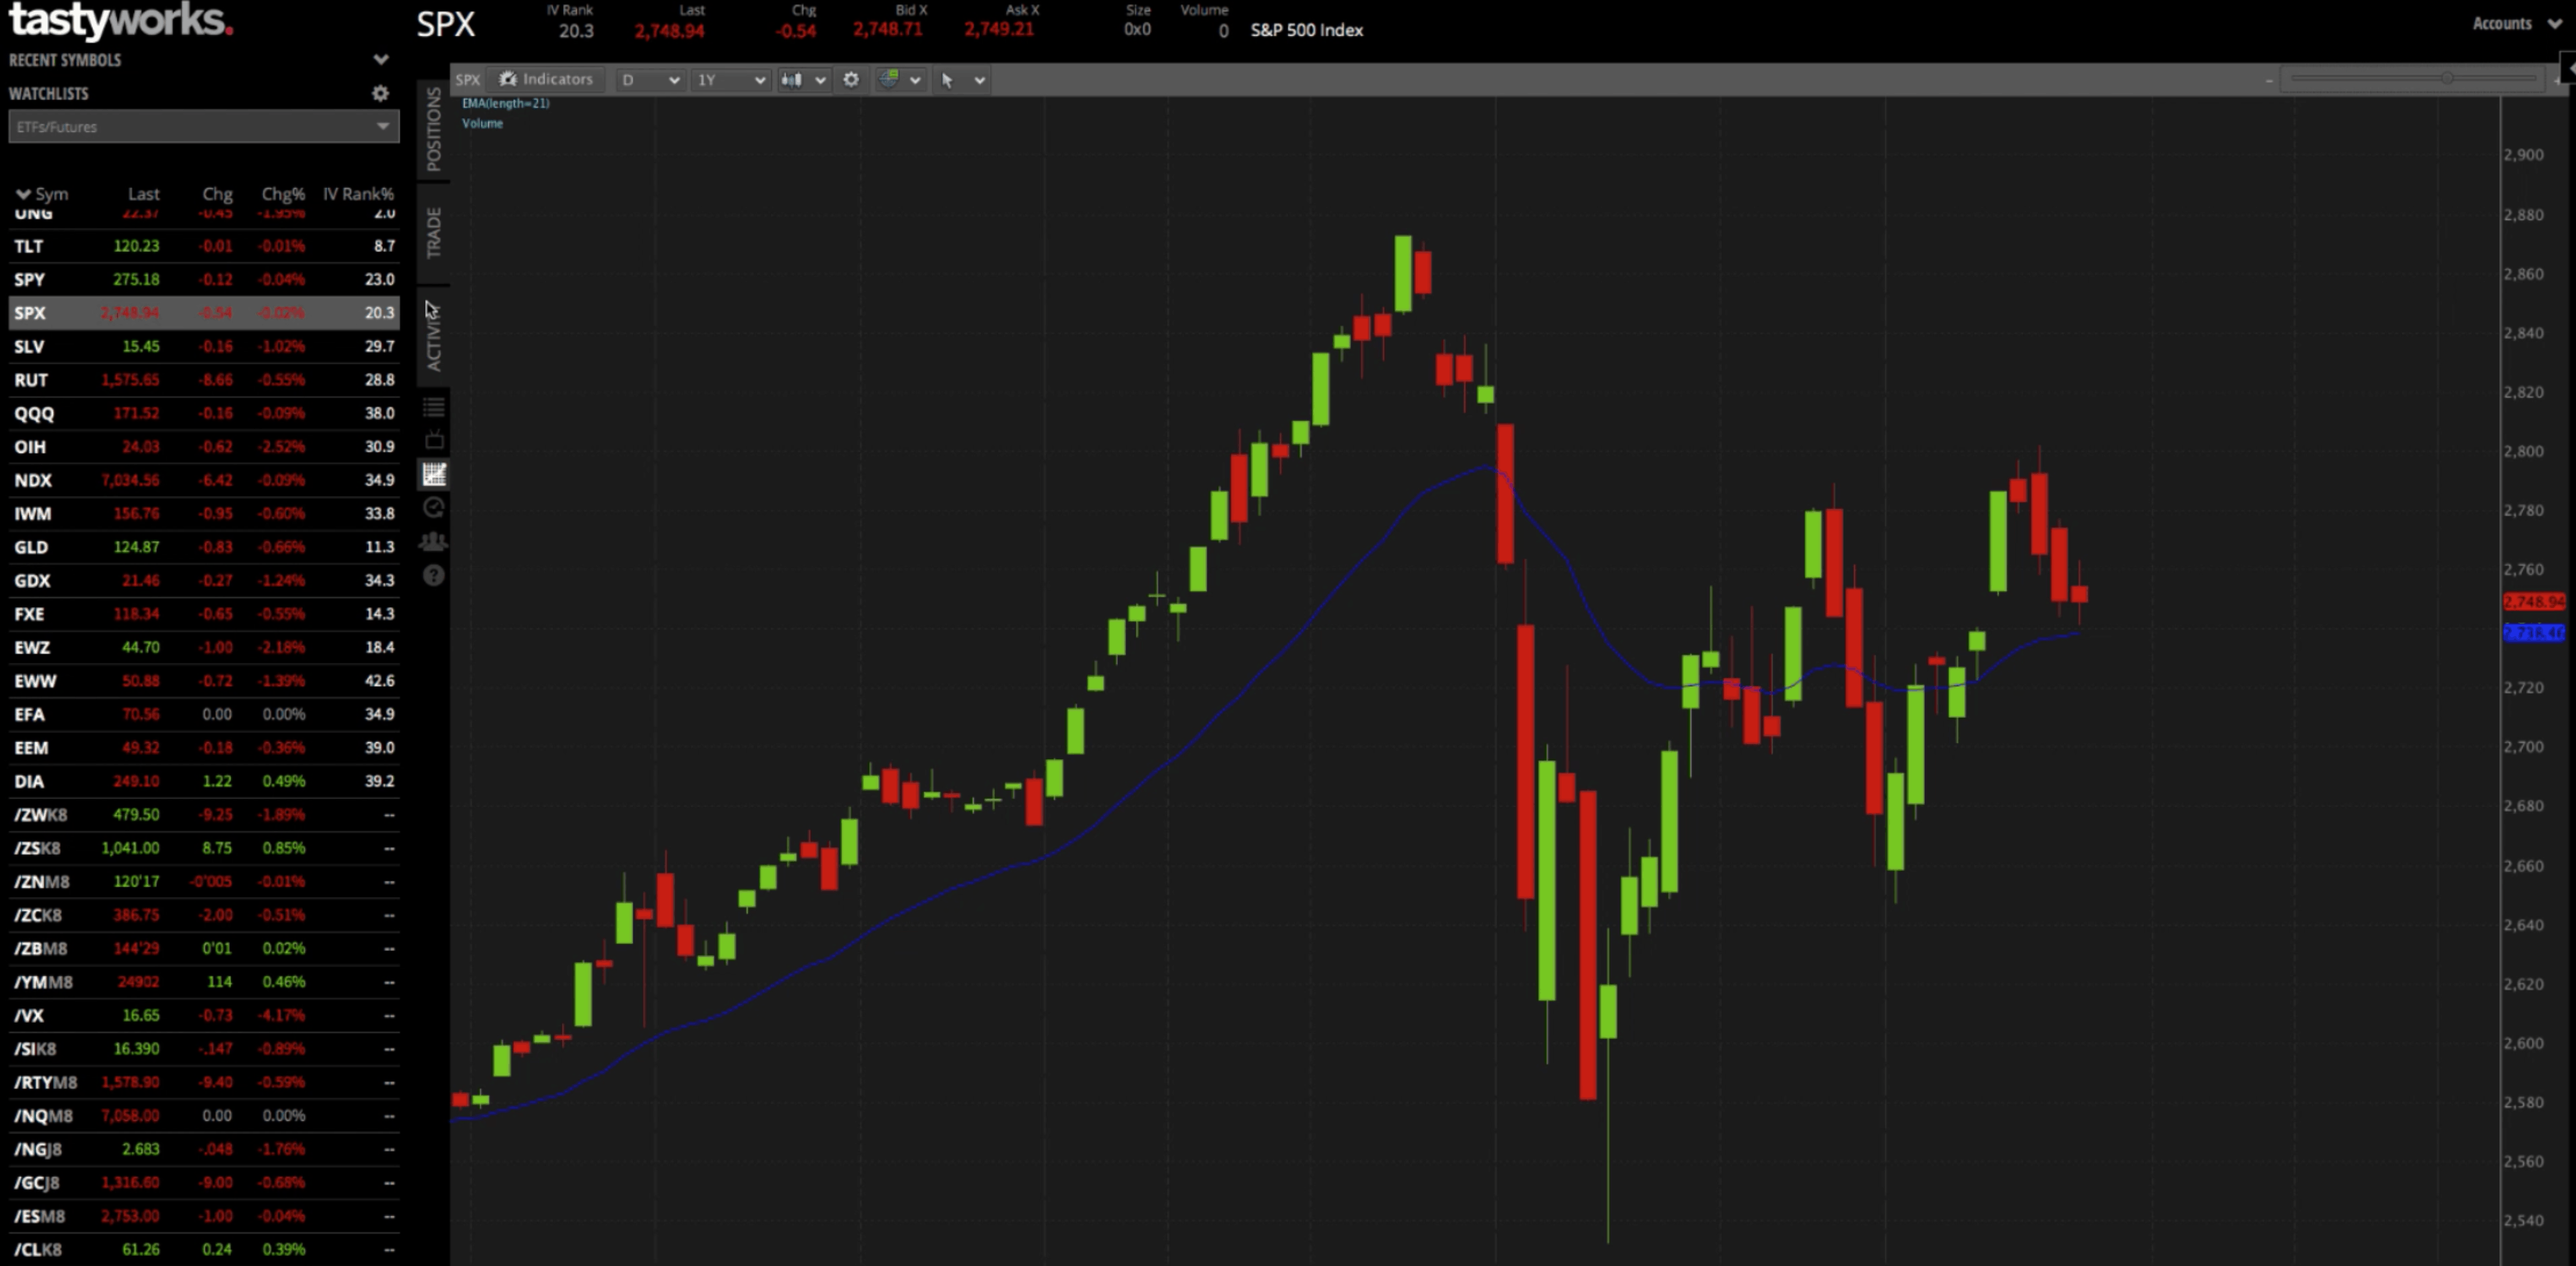
In this tutorial I want to show you how to set up a Butterfly Spread on the tastyworks platform. We’re looking at a chart of SPX, the S&P 500.

Trade Tab
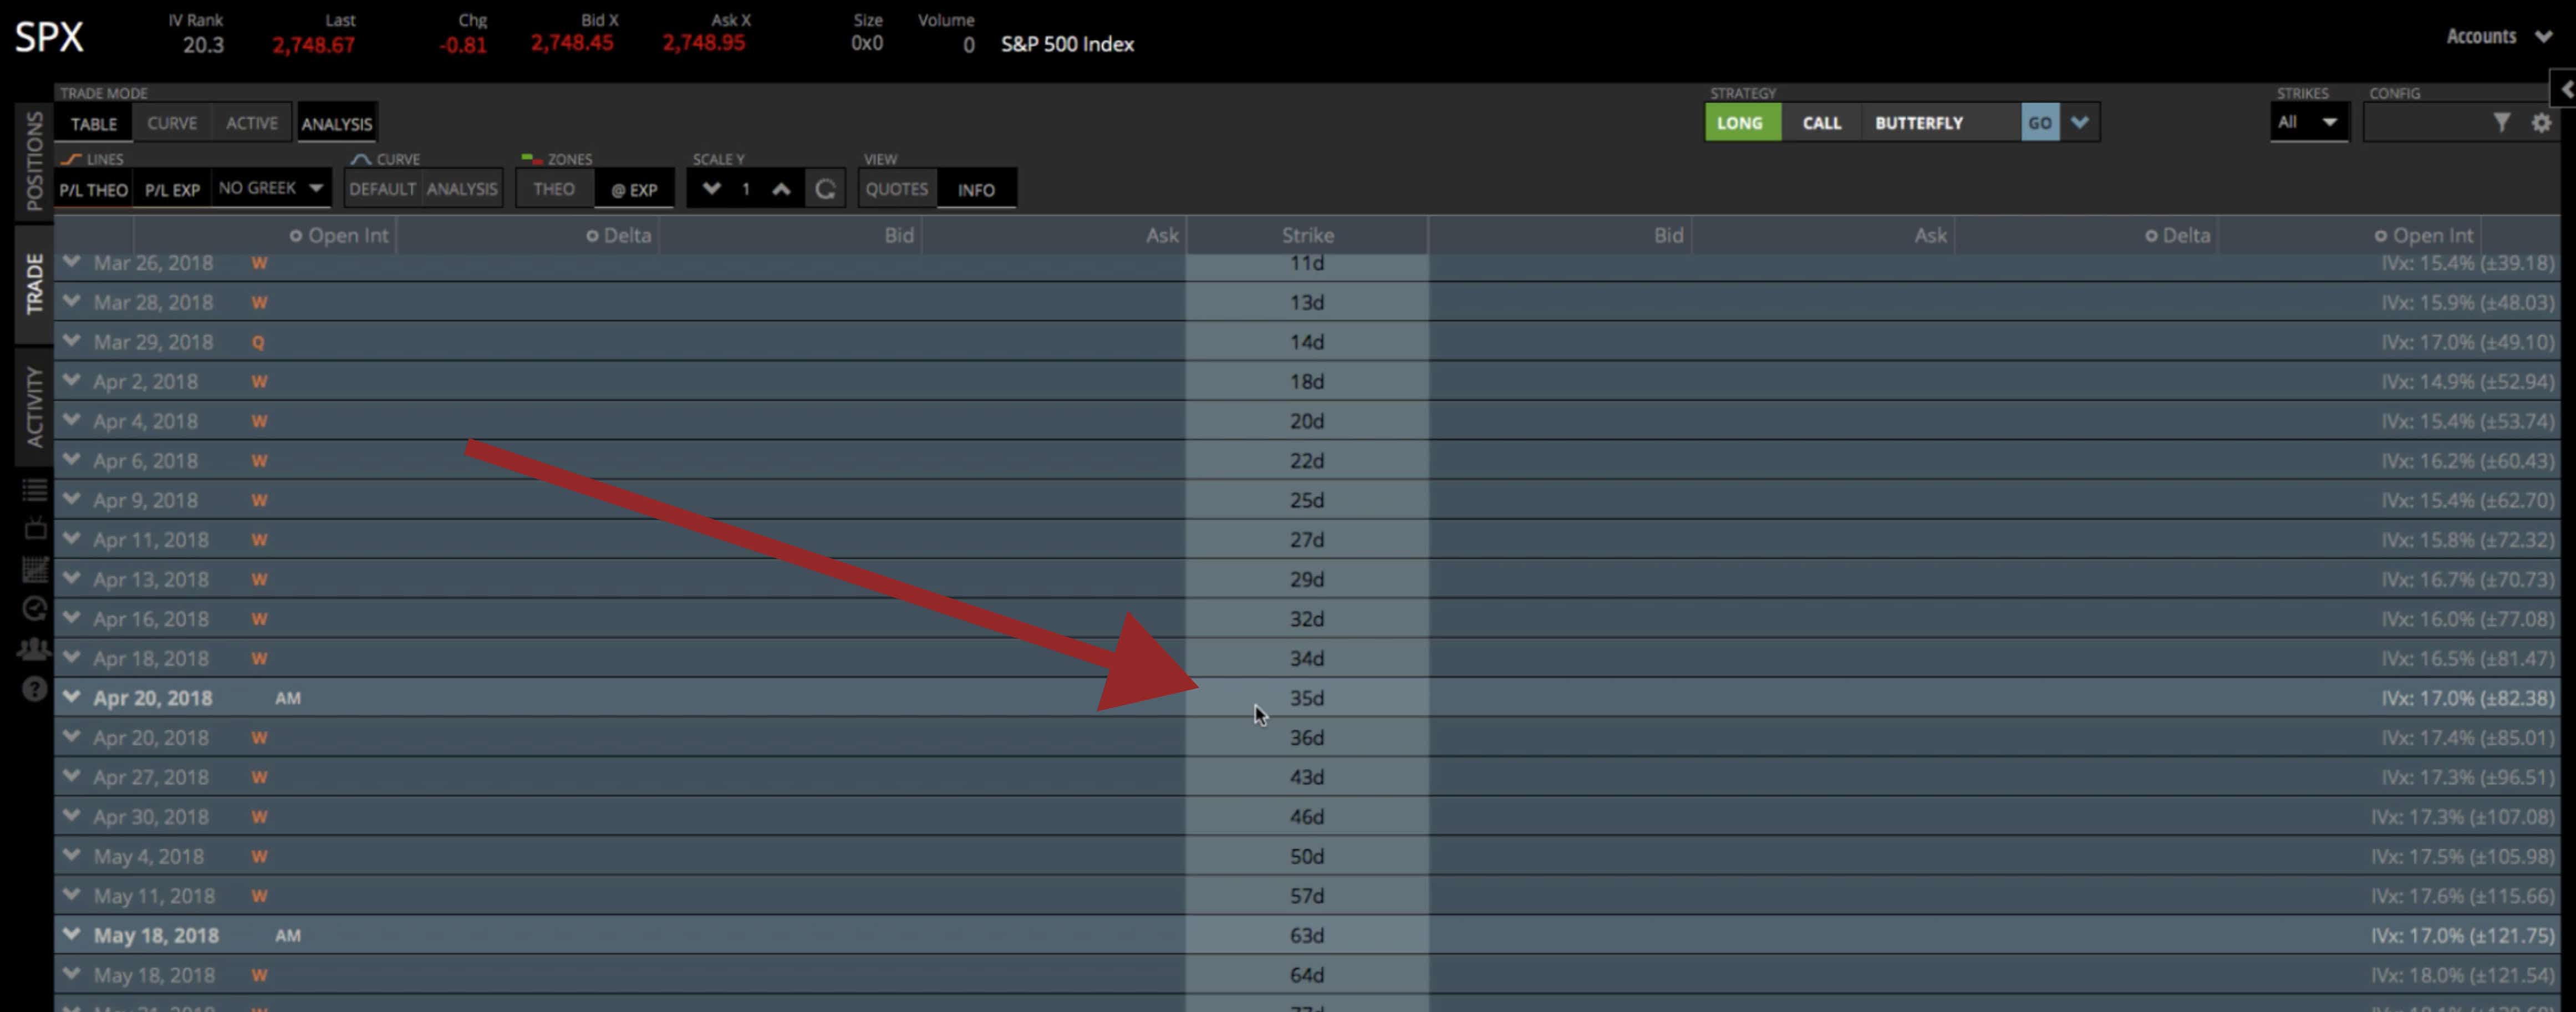
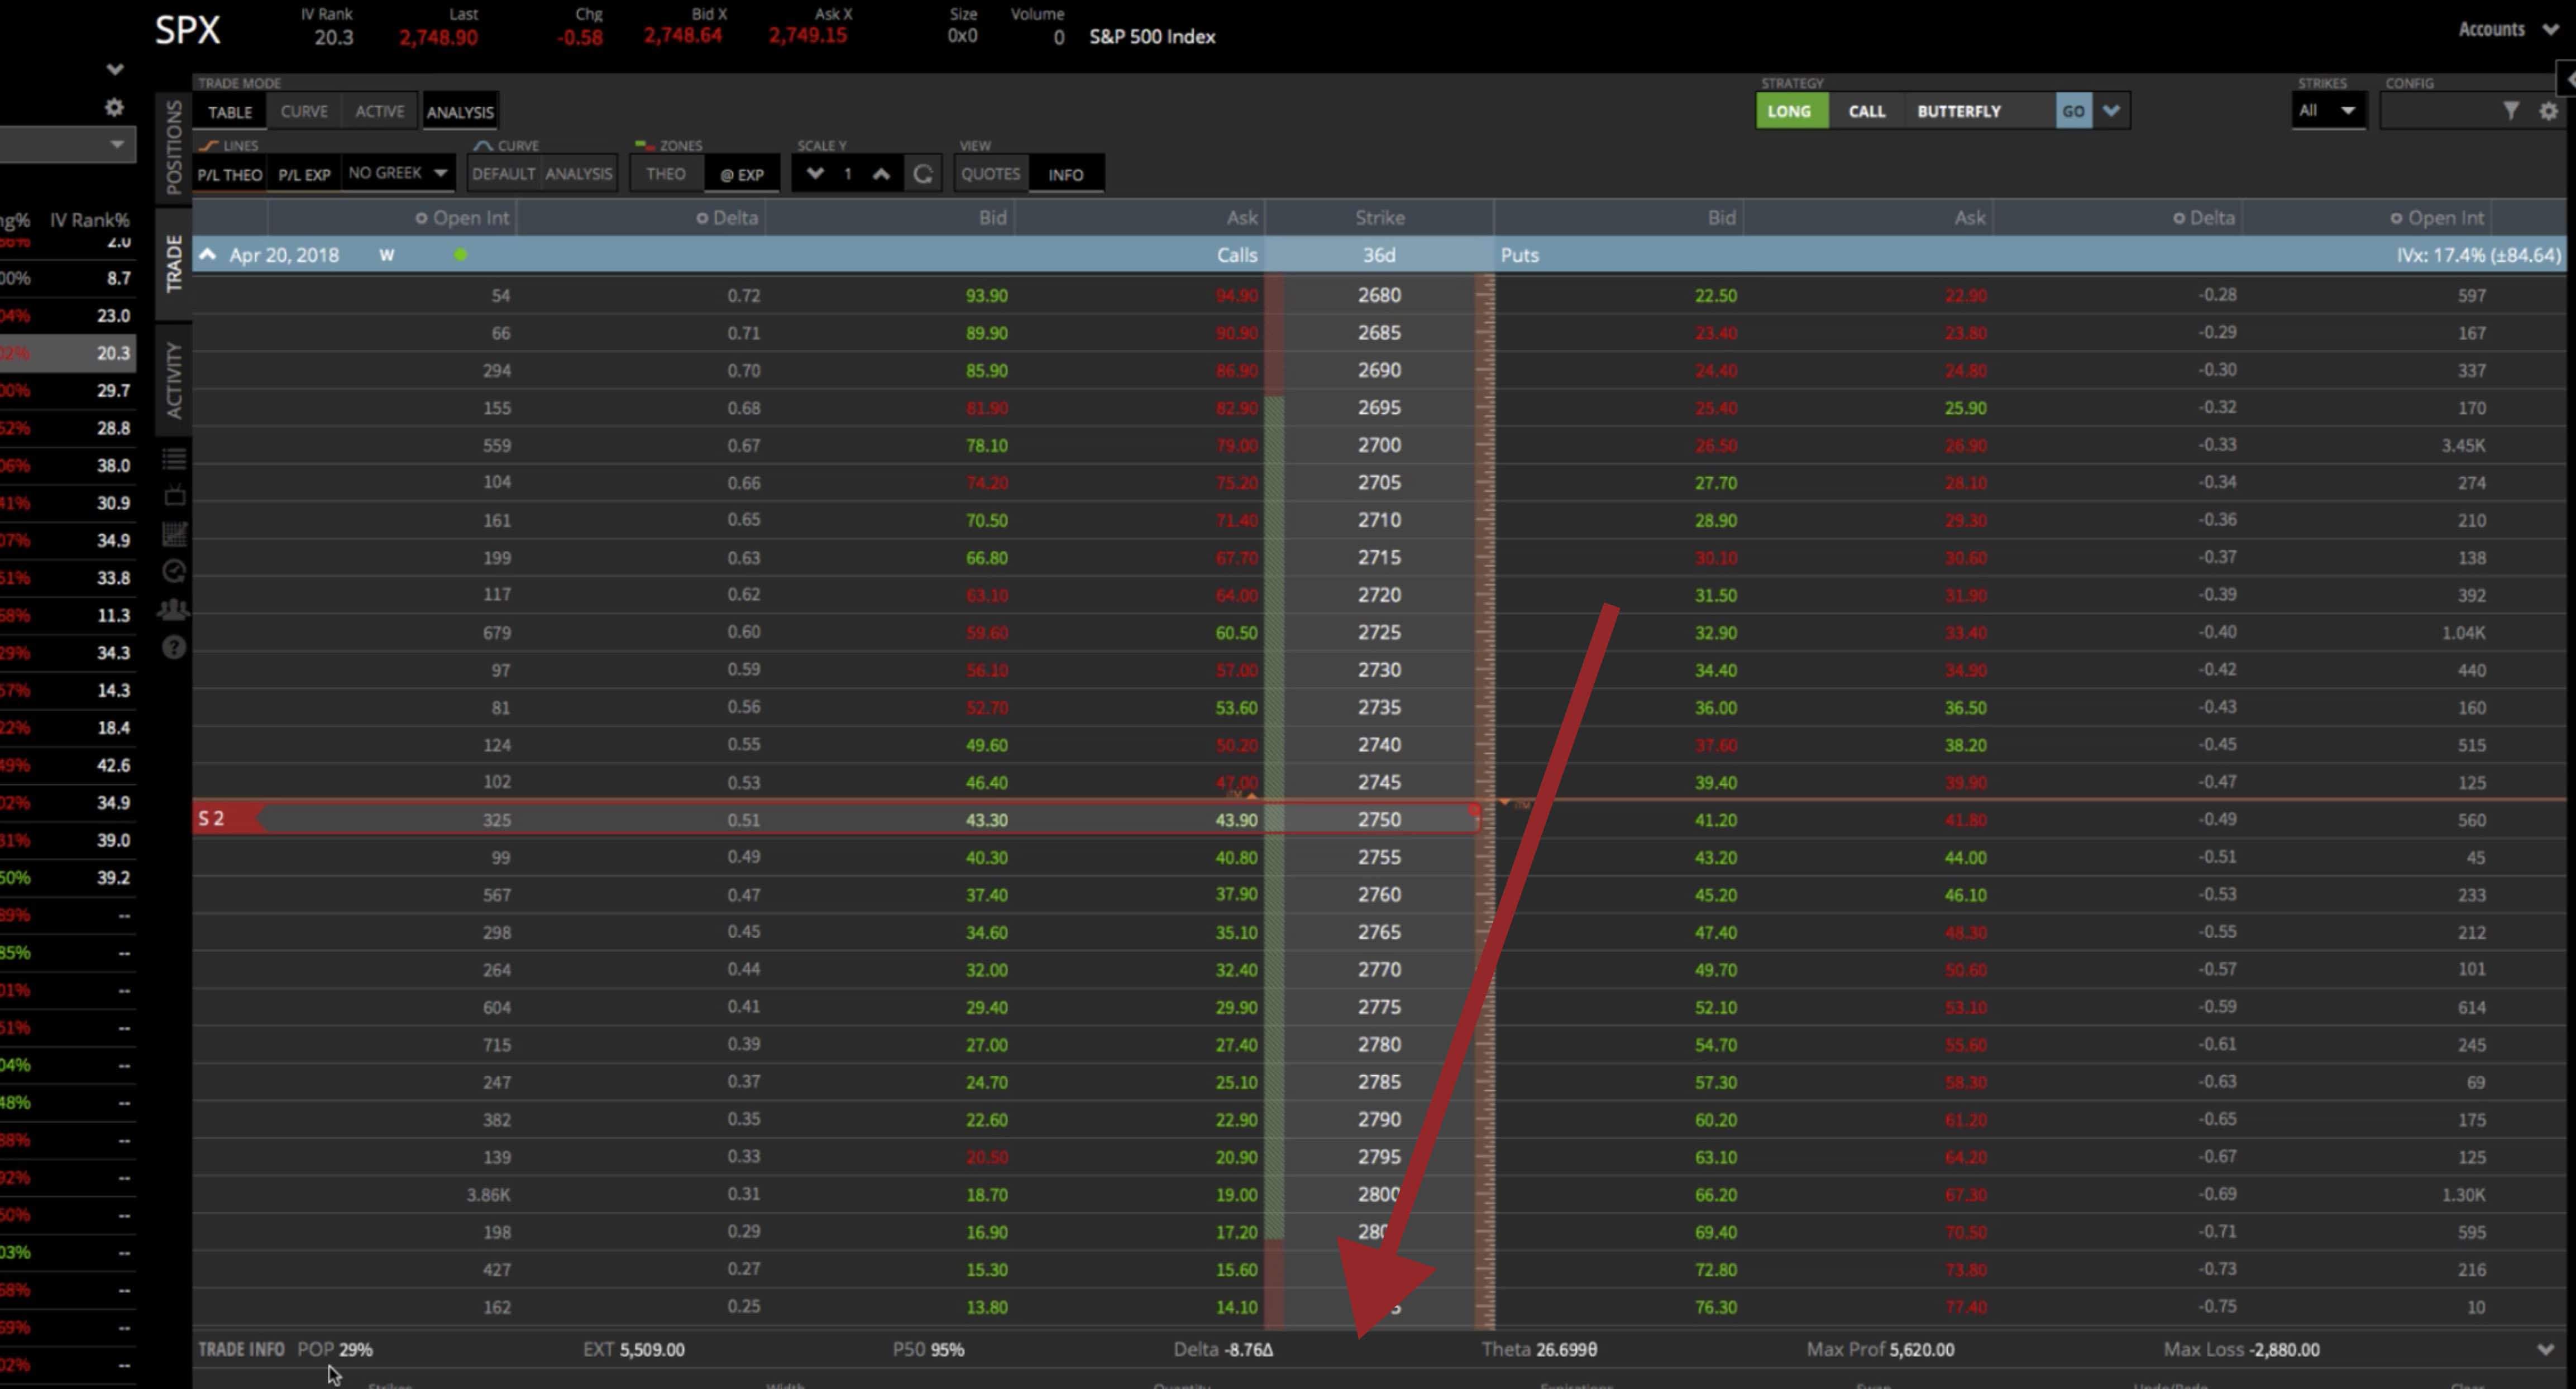
If you want to set up a butterfly spread in SPX, you would go to the trade tab (all the different option chains are shown) and choose the option chain with 30 to 60 days to expiration. You want to stay in the monthlies. That would be right at 35 days to expiration. Then click the drop down, which opens up all the different strikes to choose from.

When we put on a Butterfly, you can do it as all calls, or as all puts. We tend to do our Butterflies with all calls. Our back tested studies show that they perform just a little bit better, but there’s not a whole lot of difference if you do all puts or all calls.
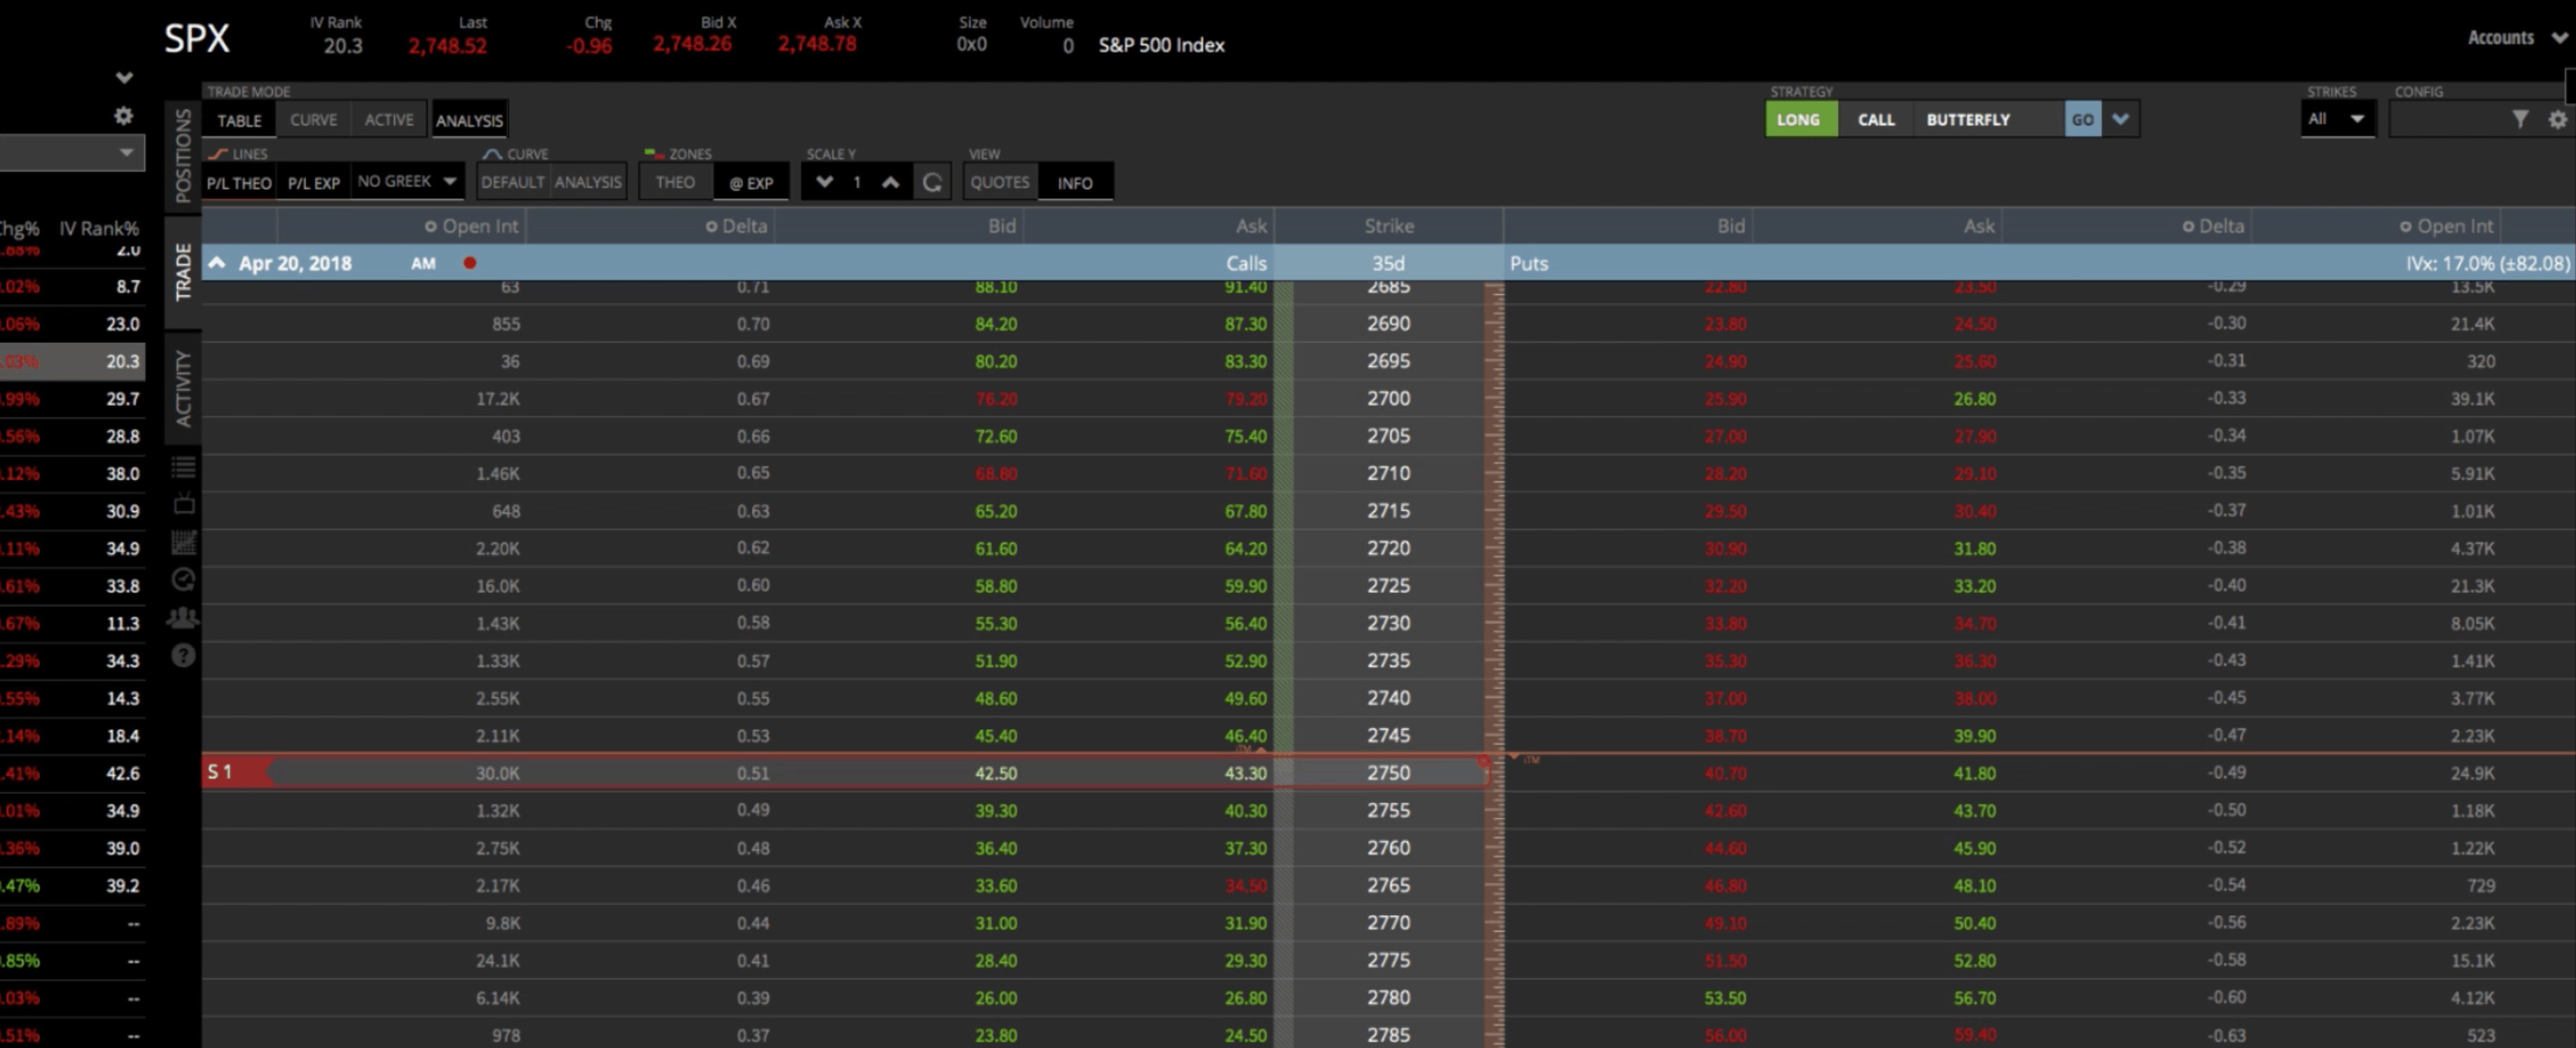
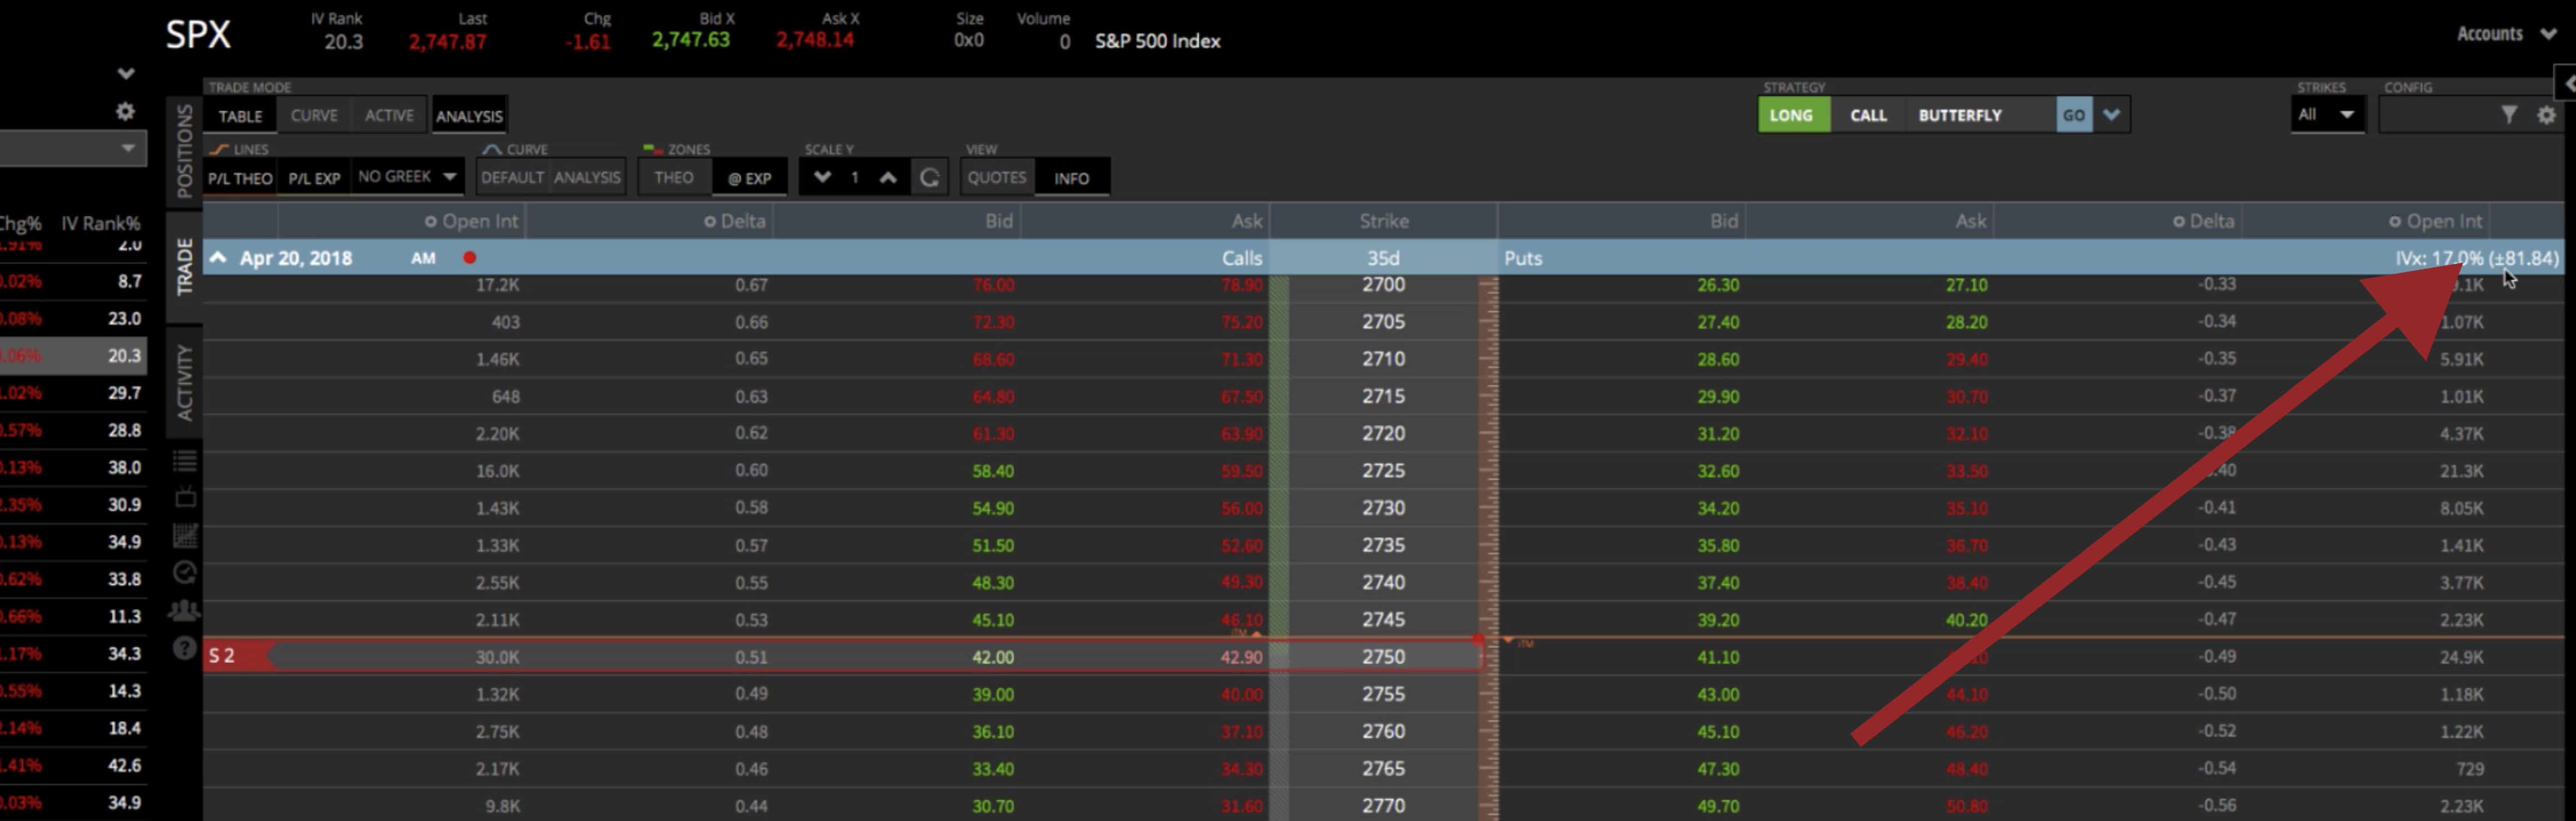
With a Butterfly Spread, we’re going to sell the at-the-money strikes, and then we’re going to buy the wings above and below the at-the-money strikes. You’re going to sell twice as many as you do the wings. I’ll show you what I mean. We can do this manually by choosing the at-the-money strike, which in this case, is 2750. Then click on the bid to sell. Now you see that it’s highlighted with red and it shows S1 over to the left.

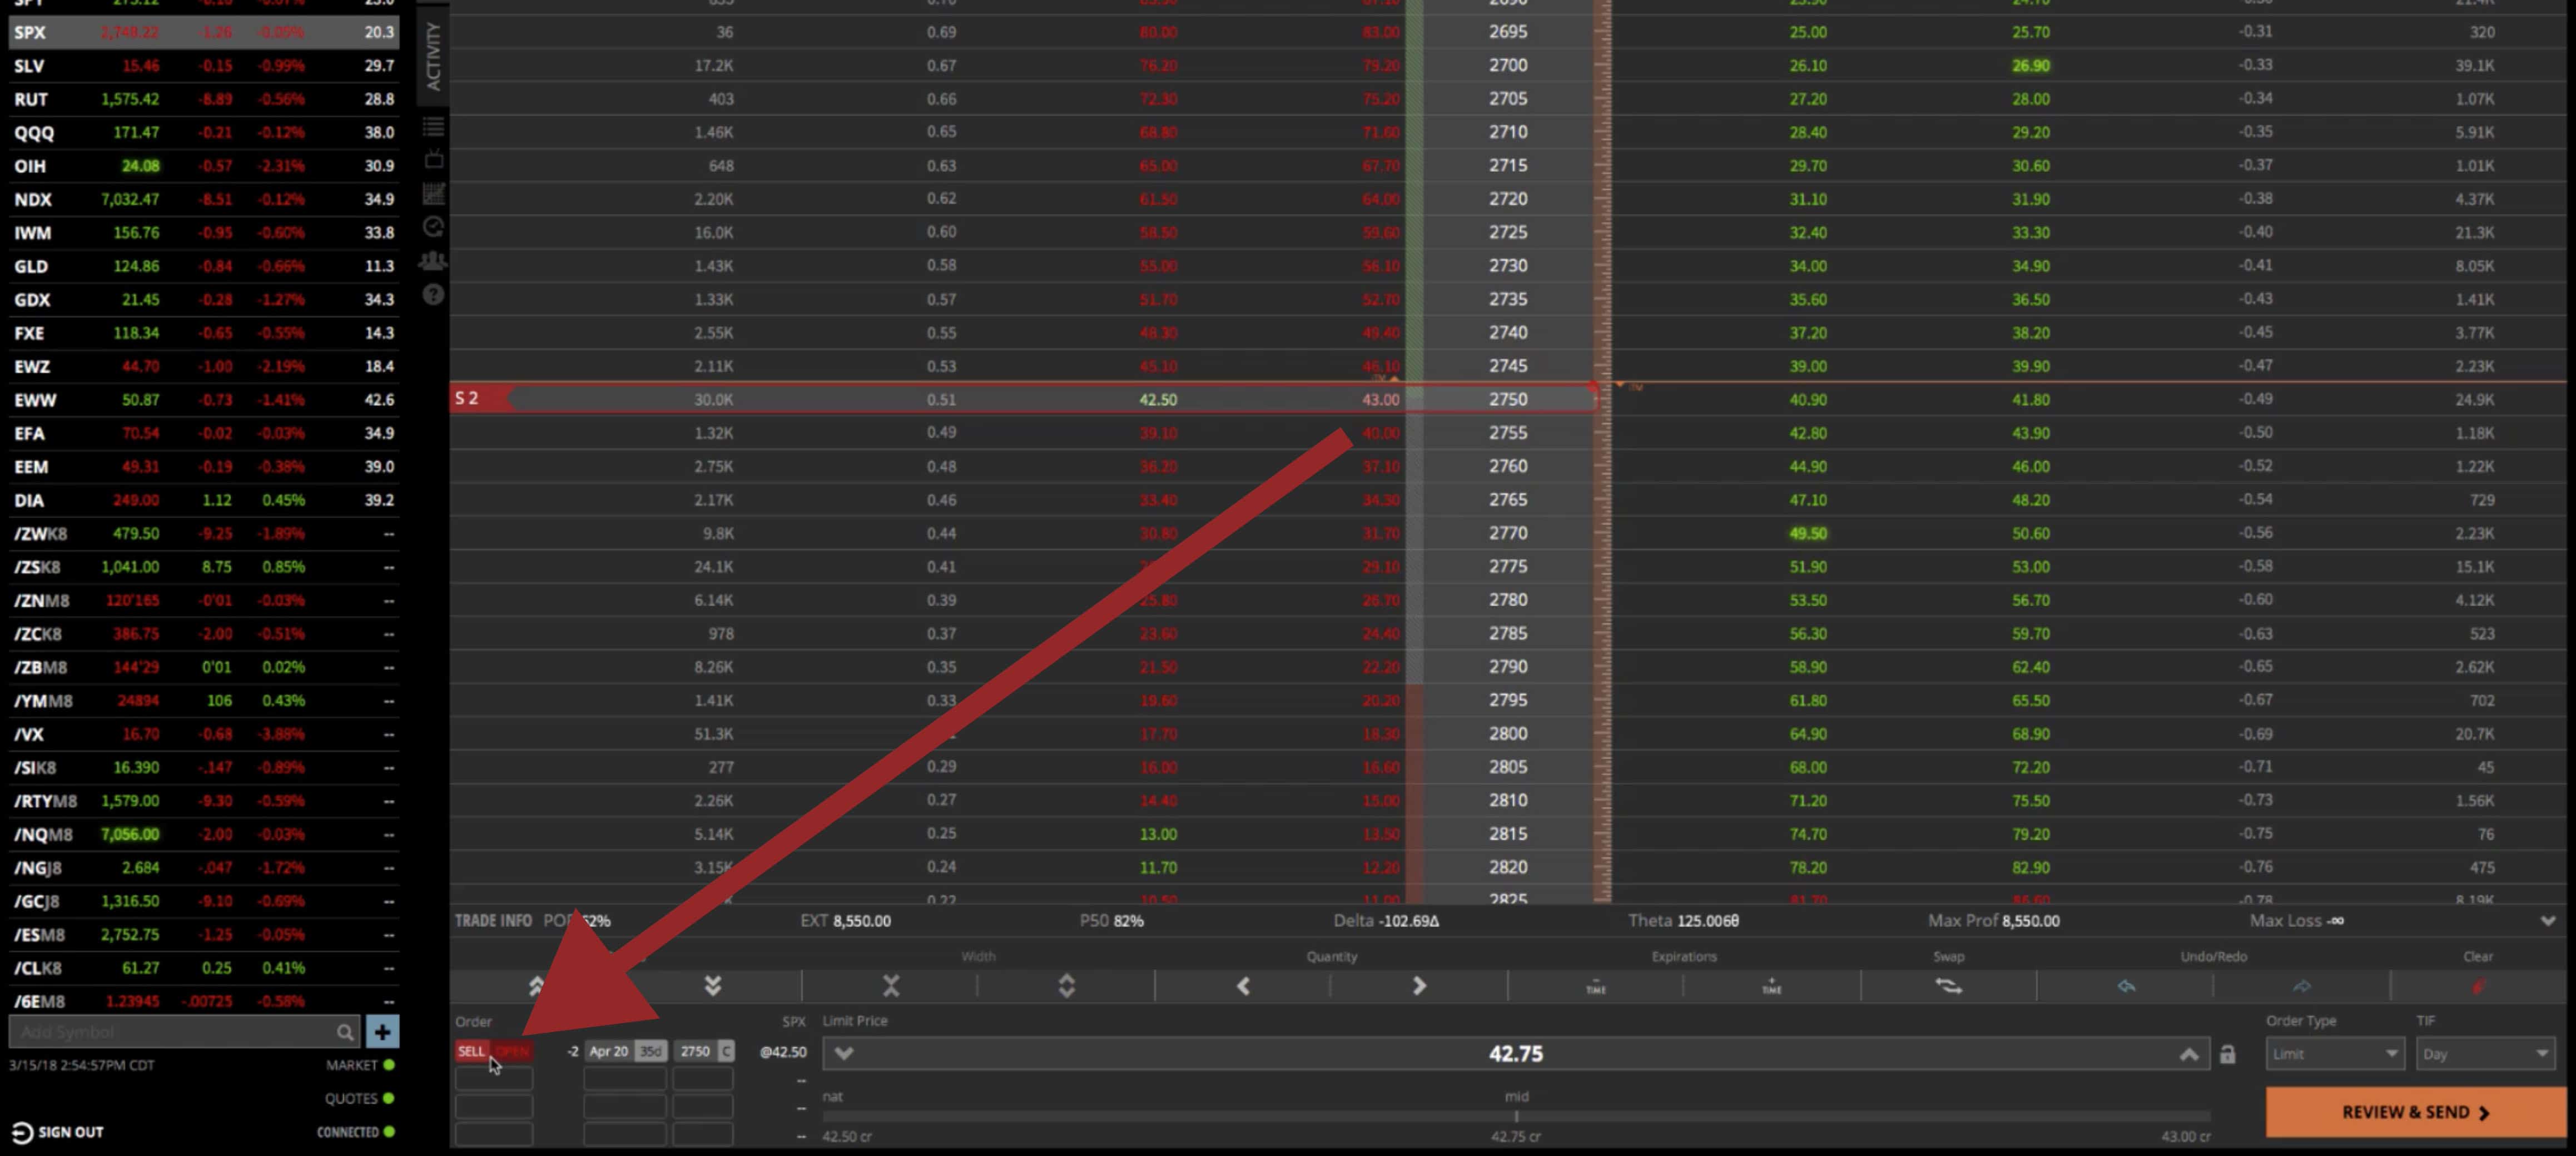
But we don’t want just one contract, we want to do two. You simply click on the quantity arrow buttons down at the bottom of the platform, and change S1 to S2. We’re selling two contracts at that strike. You can also see the quantity down below in your order. Sell to open, -2, meaning we’re selling two. In that same order area, you see 35 days to expiration in the appropriate cycle. And the strike is 2750. So that’s what we call the body of our butterfly, now we need to buy the wings.

To do that, you’re going to go to the strikes that you want. In this case, the way that we pick the different strikes, or the way that we pick our “wing width”, is we look at the expected move. So in the next 35 days until these options expire, the expected move in SPX is plus or minus, call it 82 points.

We want to buy our wings beyond the expected move, so let’s just call it 85. What we’ll do is count 85 points from the at the money. That’ll be the 2835. Then to buy, simply click on the ask.
It defaults to the same number of contracts, so it’s showing us buying two. Remember, we want to buy half as many as we sold at the money. What we need to do is highlight that, click on quantity, and kick that down to one. You’ll see a change from B2 to B1. Now we’re selling two at the money, we’re buying one of the wings, 85 points away, because that’s beyond the expected move. Now, we need to buy another wing below the current price.
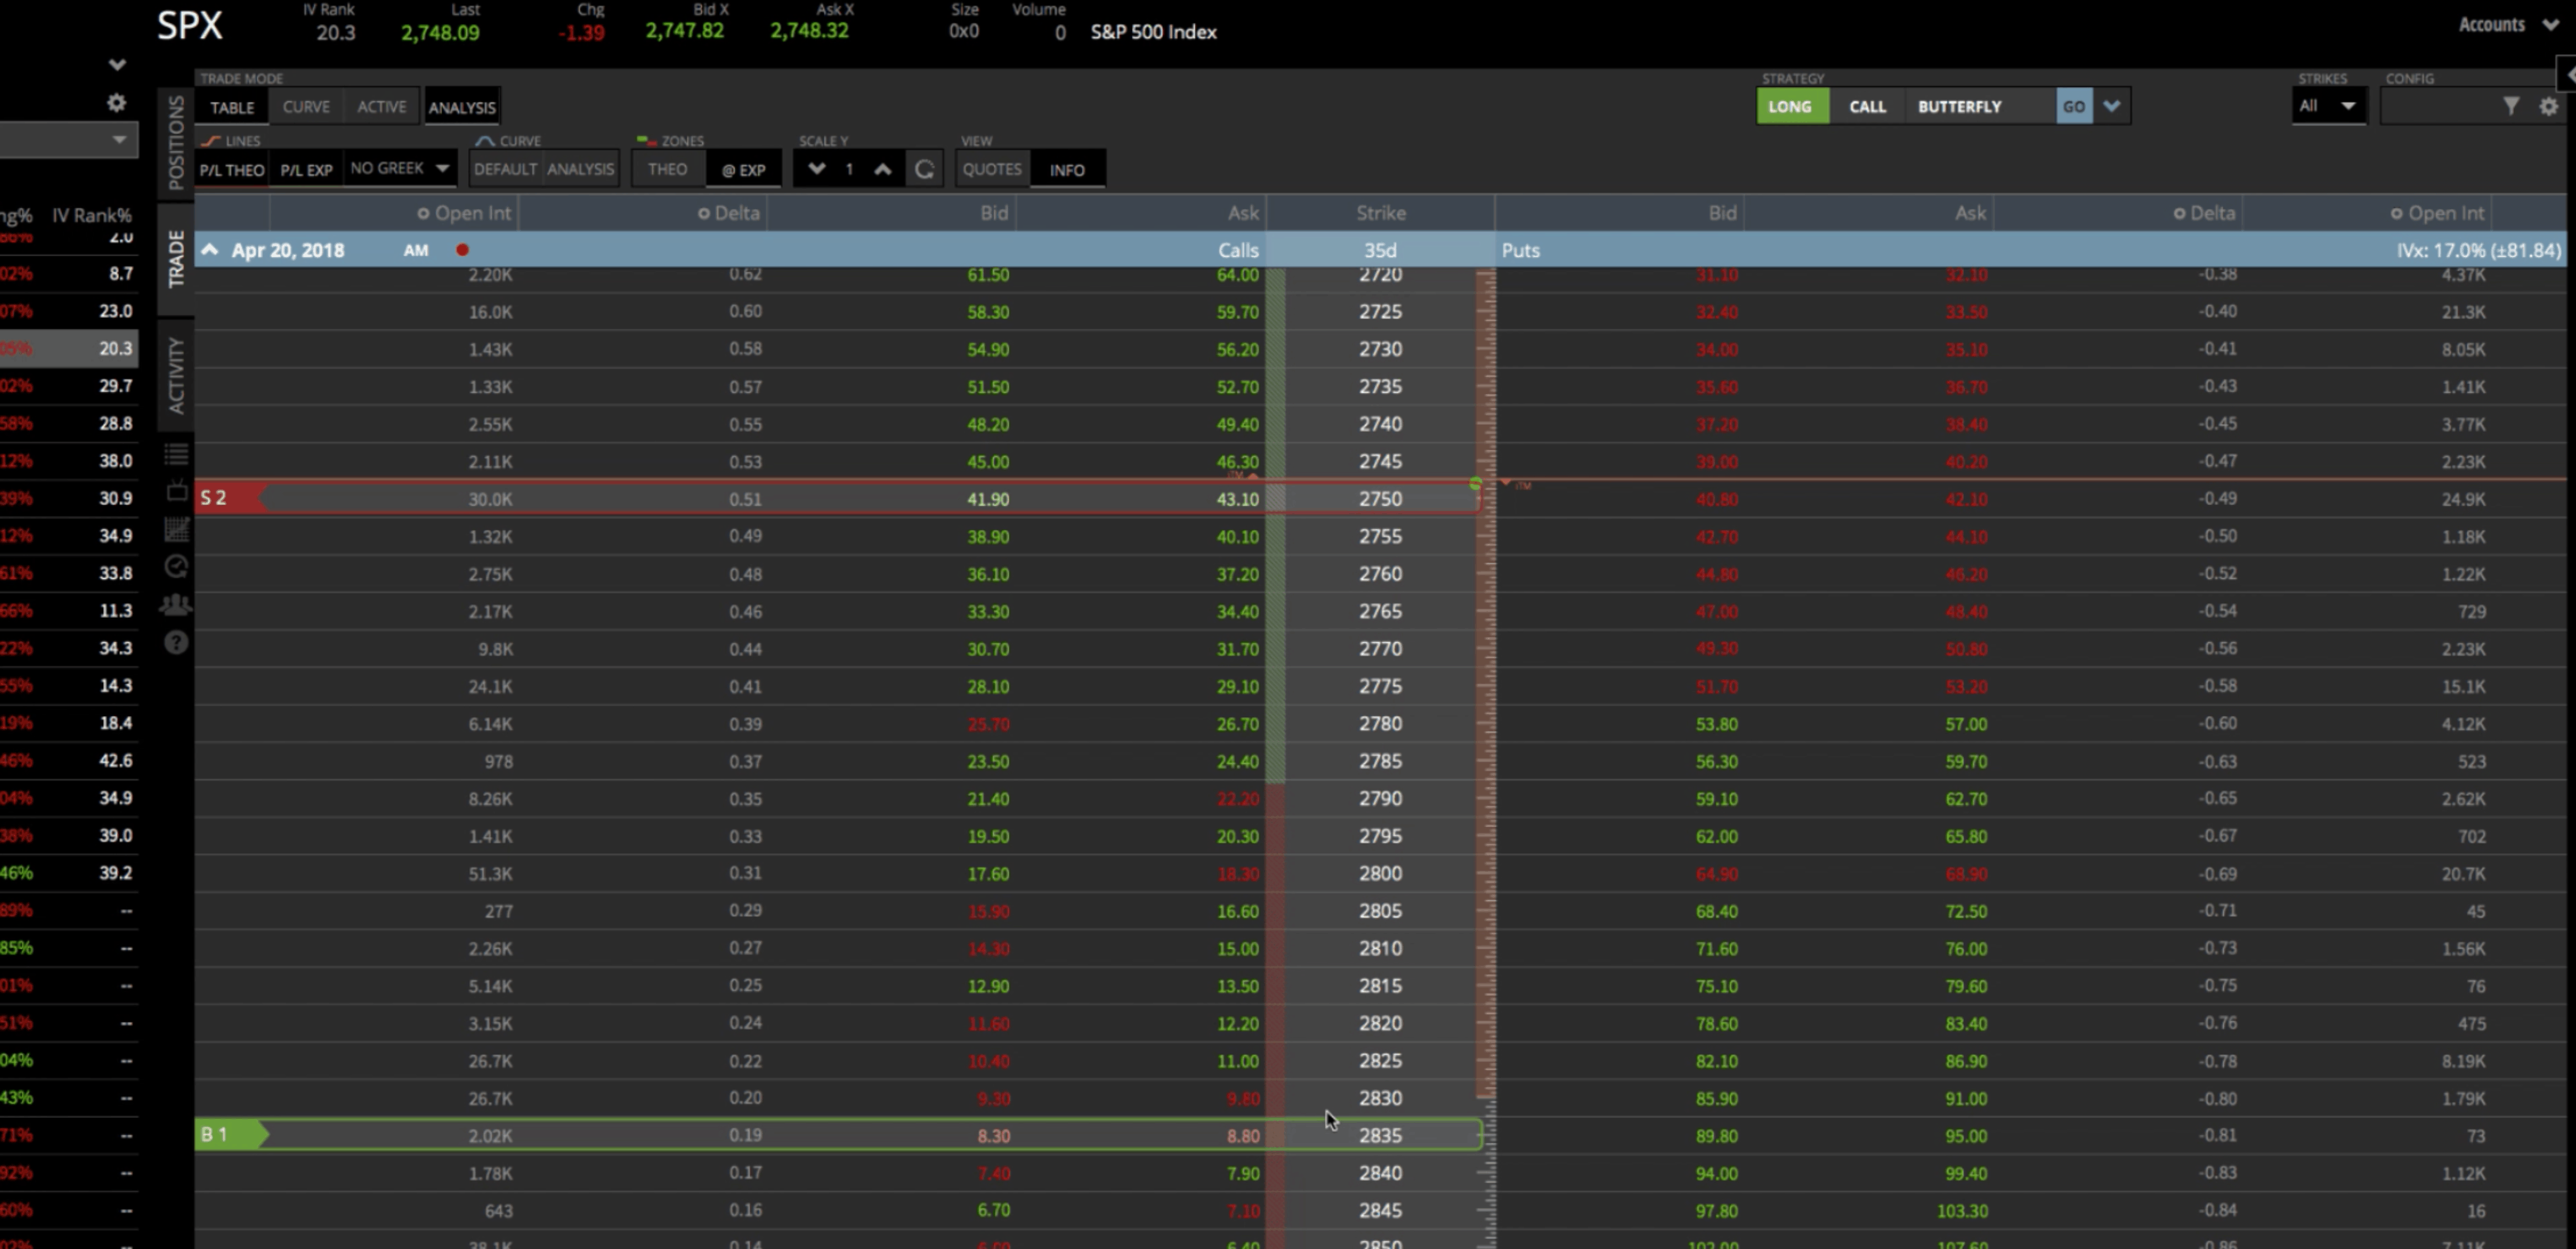

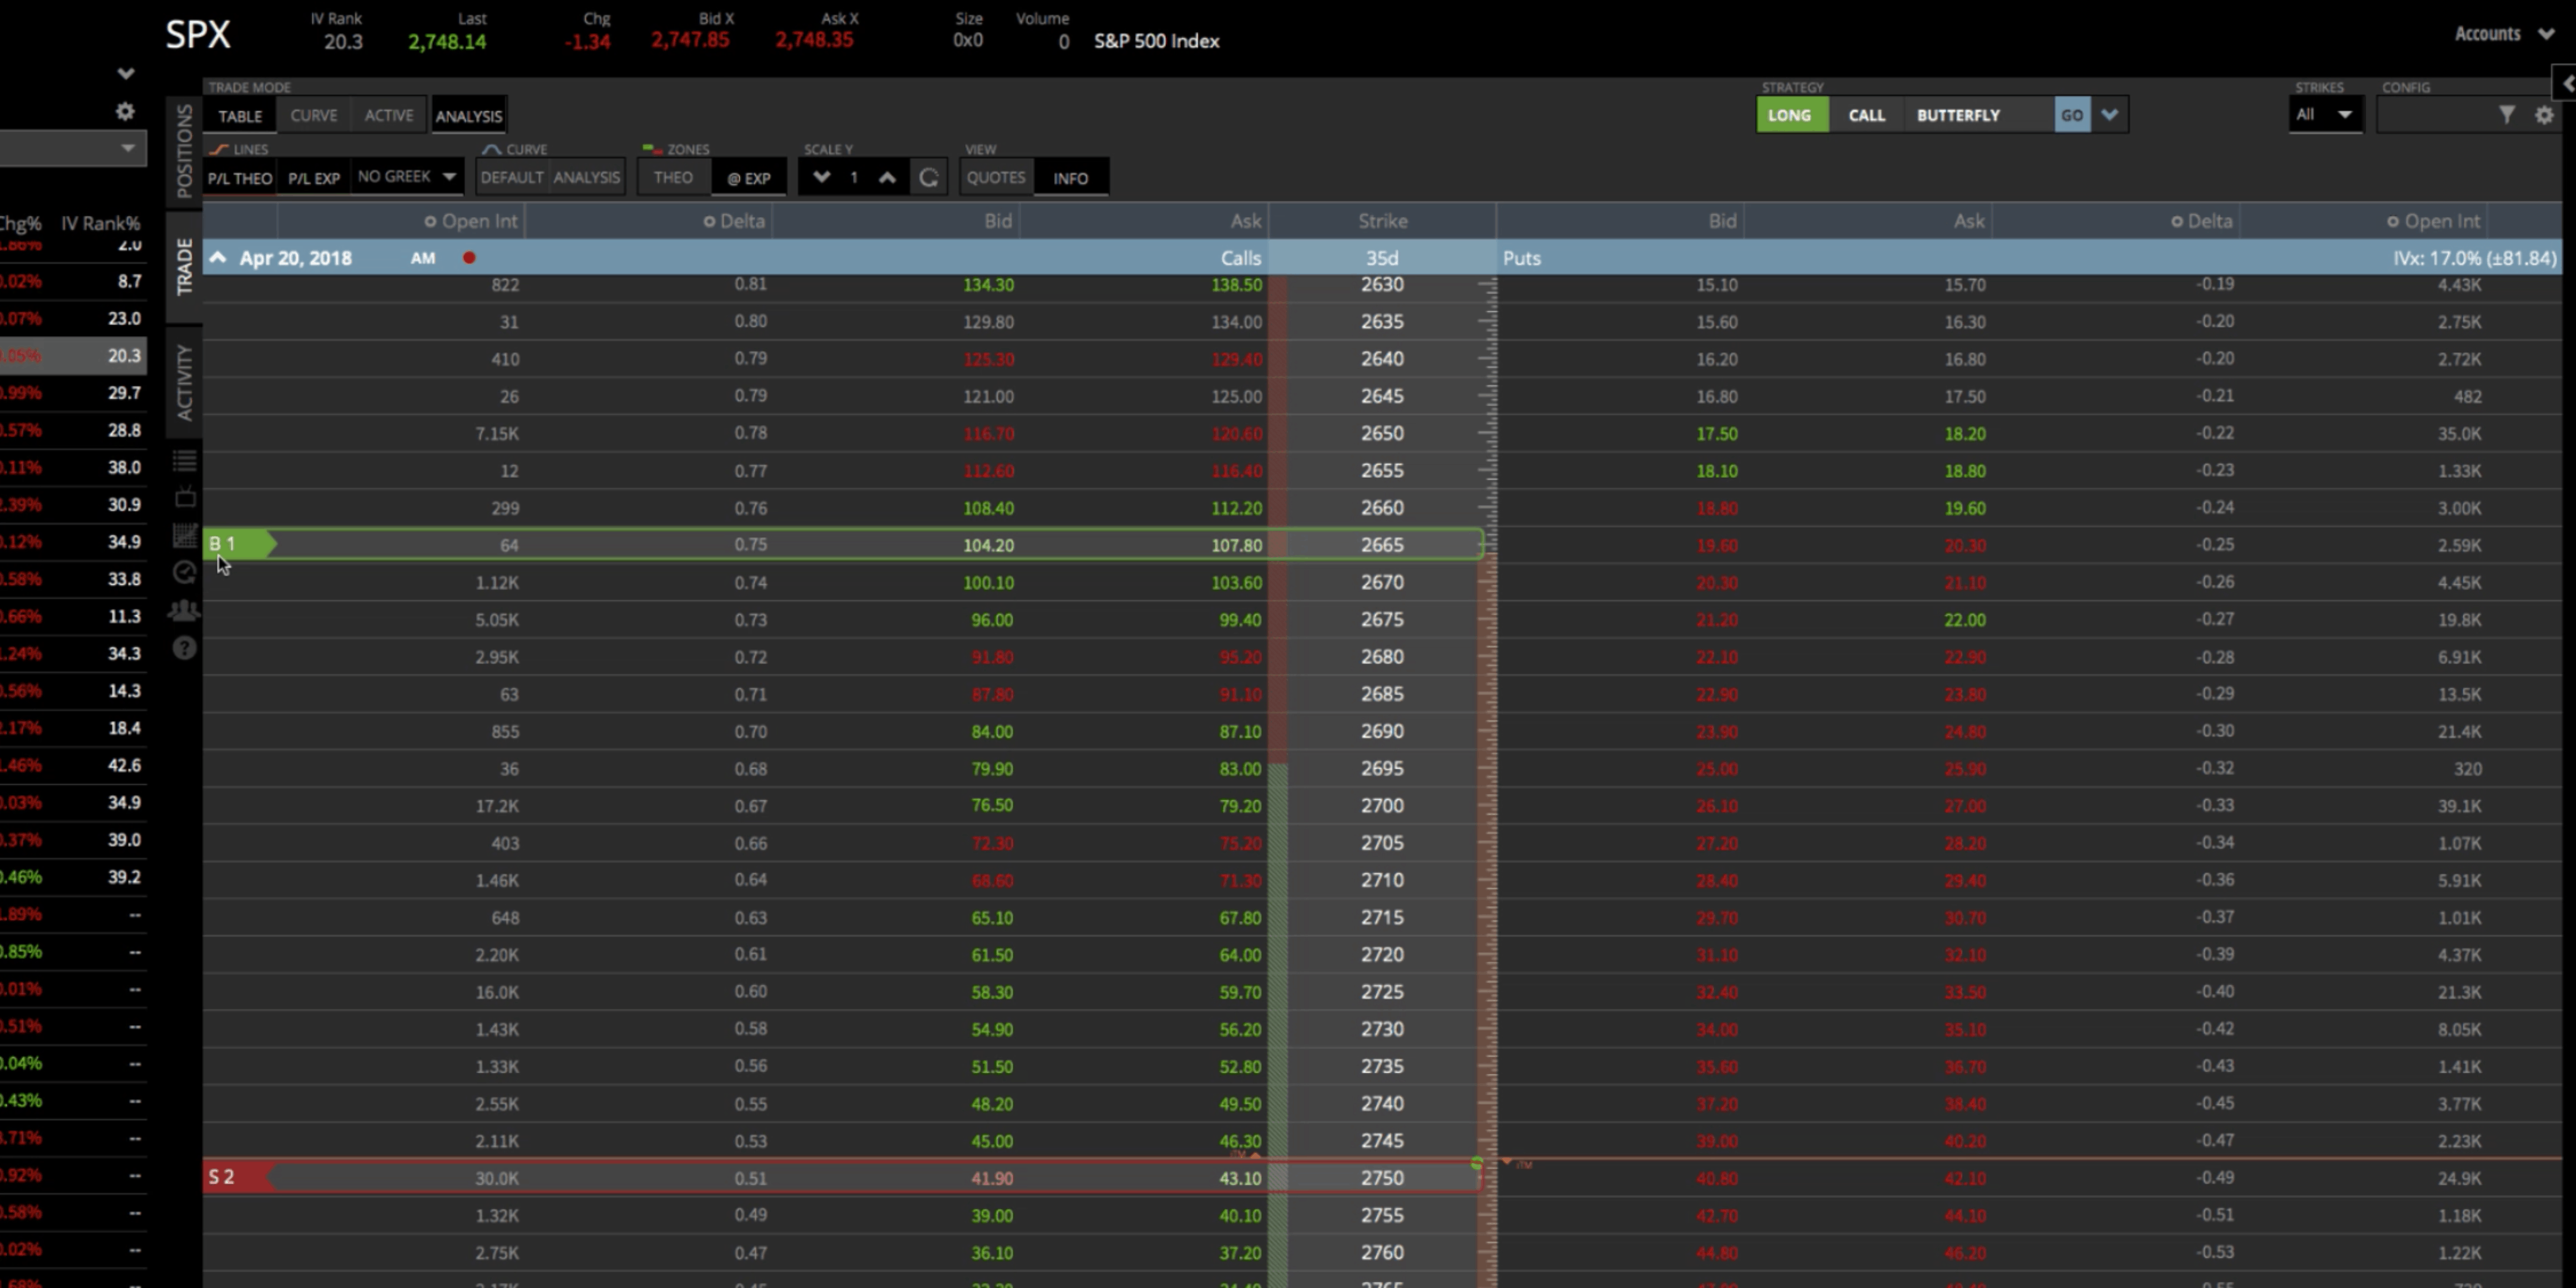
Do the same thing, count 85 points. That’d be the 2665. Click on the ask and that populates a B1, and it’s highlighted in green, showing us buying one contract. So we’re selling two of the at-the-money and we’re buying one wing below that price and one wing above. That’s how it’s all set up.

Strategy Dropdown
Another way to set this up is to use the Strategy Drop Down, like we’ve shown in our other tastyworks demo strategies. The strategy dropdown toggles back and forth from long to short. When you enter a Butterfly, we are buying it. We want to make sure it’s set to long. You can toggle between put or call, we want to do call. Then from the drop down, choose Butterfly. Once you do that, it automatically puts that on your screen; however, it defaults to one strike out of the money.
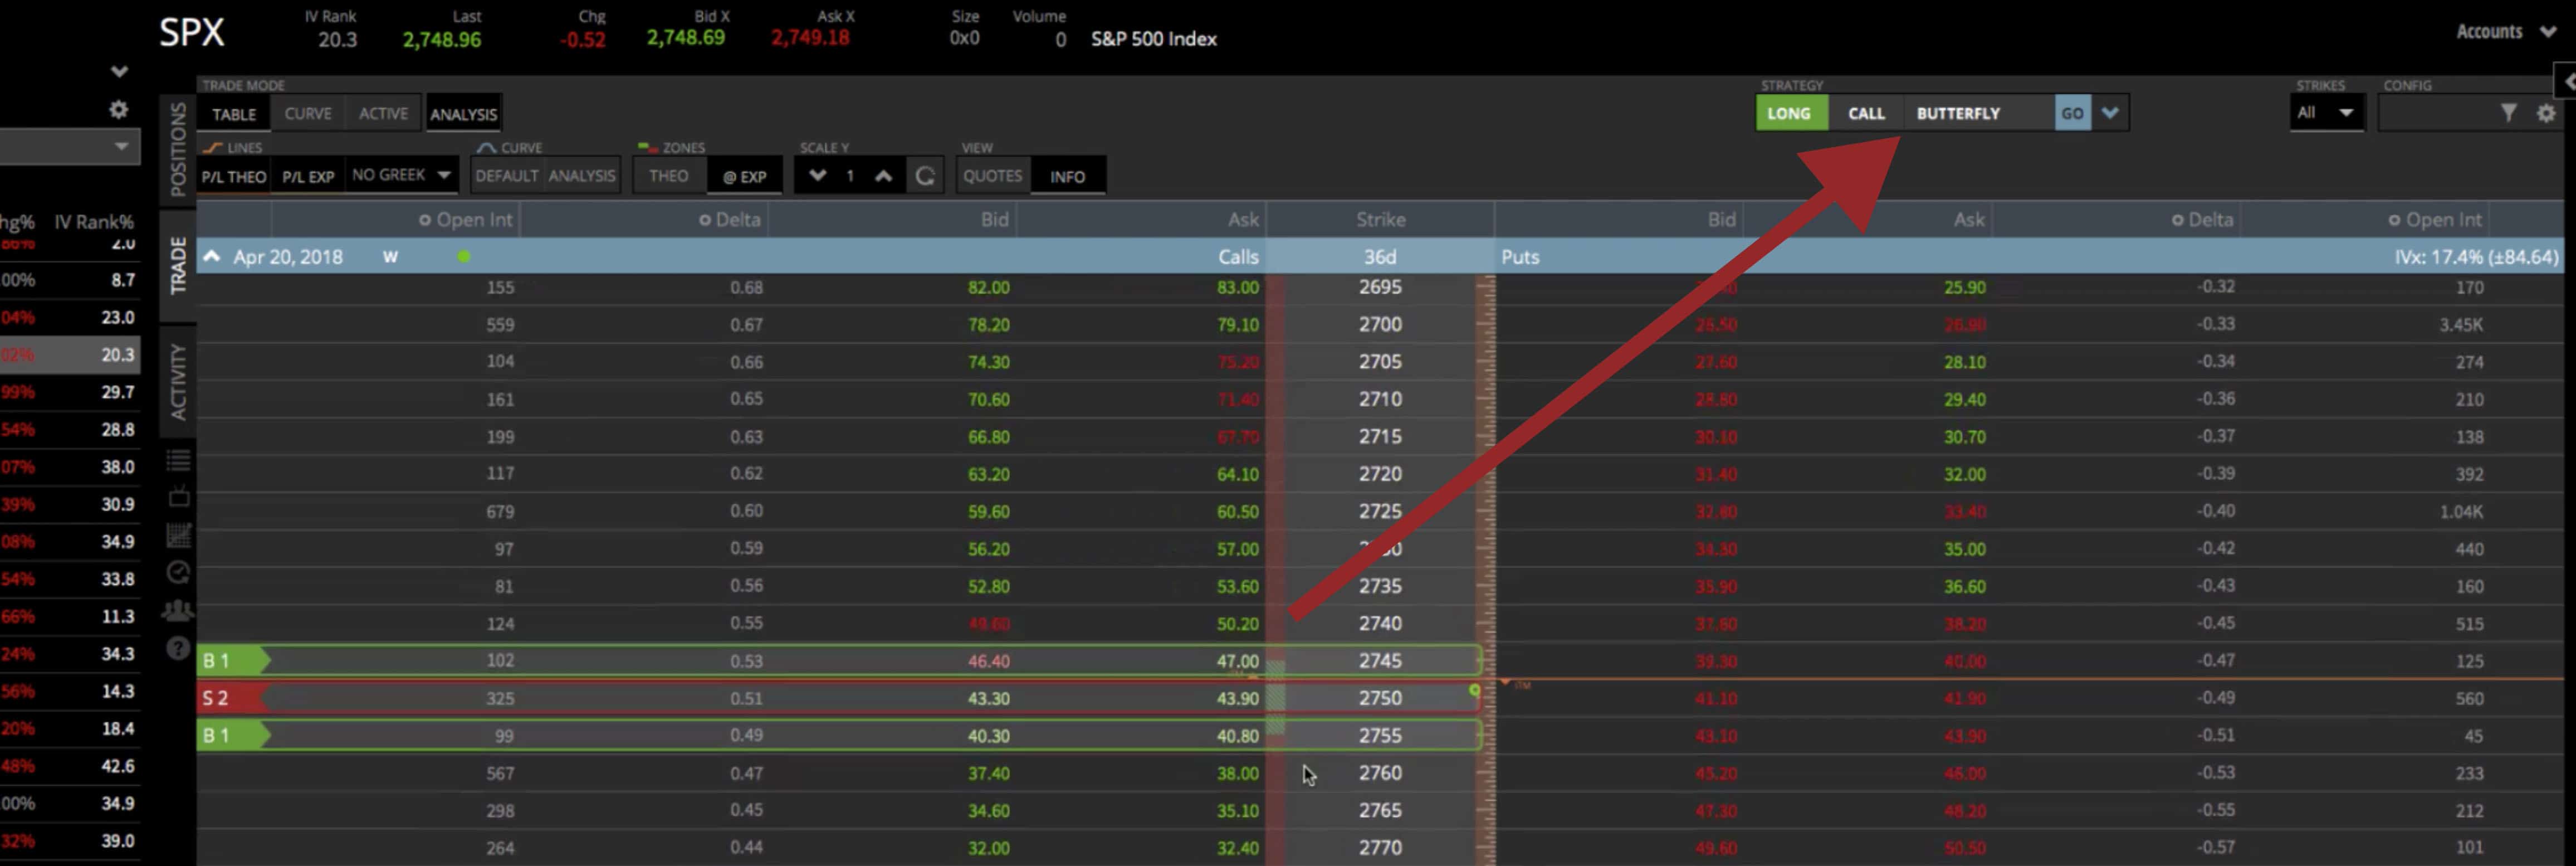

We don’t want to do that, but what you can do, is click and drag. We can drag that down to the strikes that we want. So we’re 85 points away on either side.
You can see at the bottom of the platform, that you’ve got your different statistics. Probability of profit is 29%. Probability of making 50% is 95%. You’ve got your theta, your delta, your max profit, your max loss, and everything is set to go.

If you liked that and you understand everything you’ve got here, you can go ahead and shoot that into the broker to get filled.
Curve Tab
If you’re a visual trader like myself, I like to go over to the curve mode, make sure the analysis tab is clicked as well, and that’ll bring up your visual of the butterfly. So again, this is the body where we sold the two contracts, and then these are the wings where we bought one on both side.
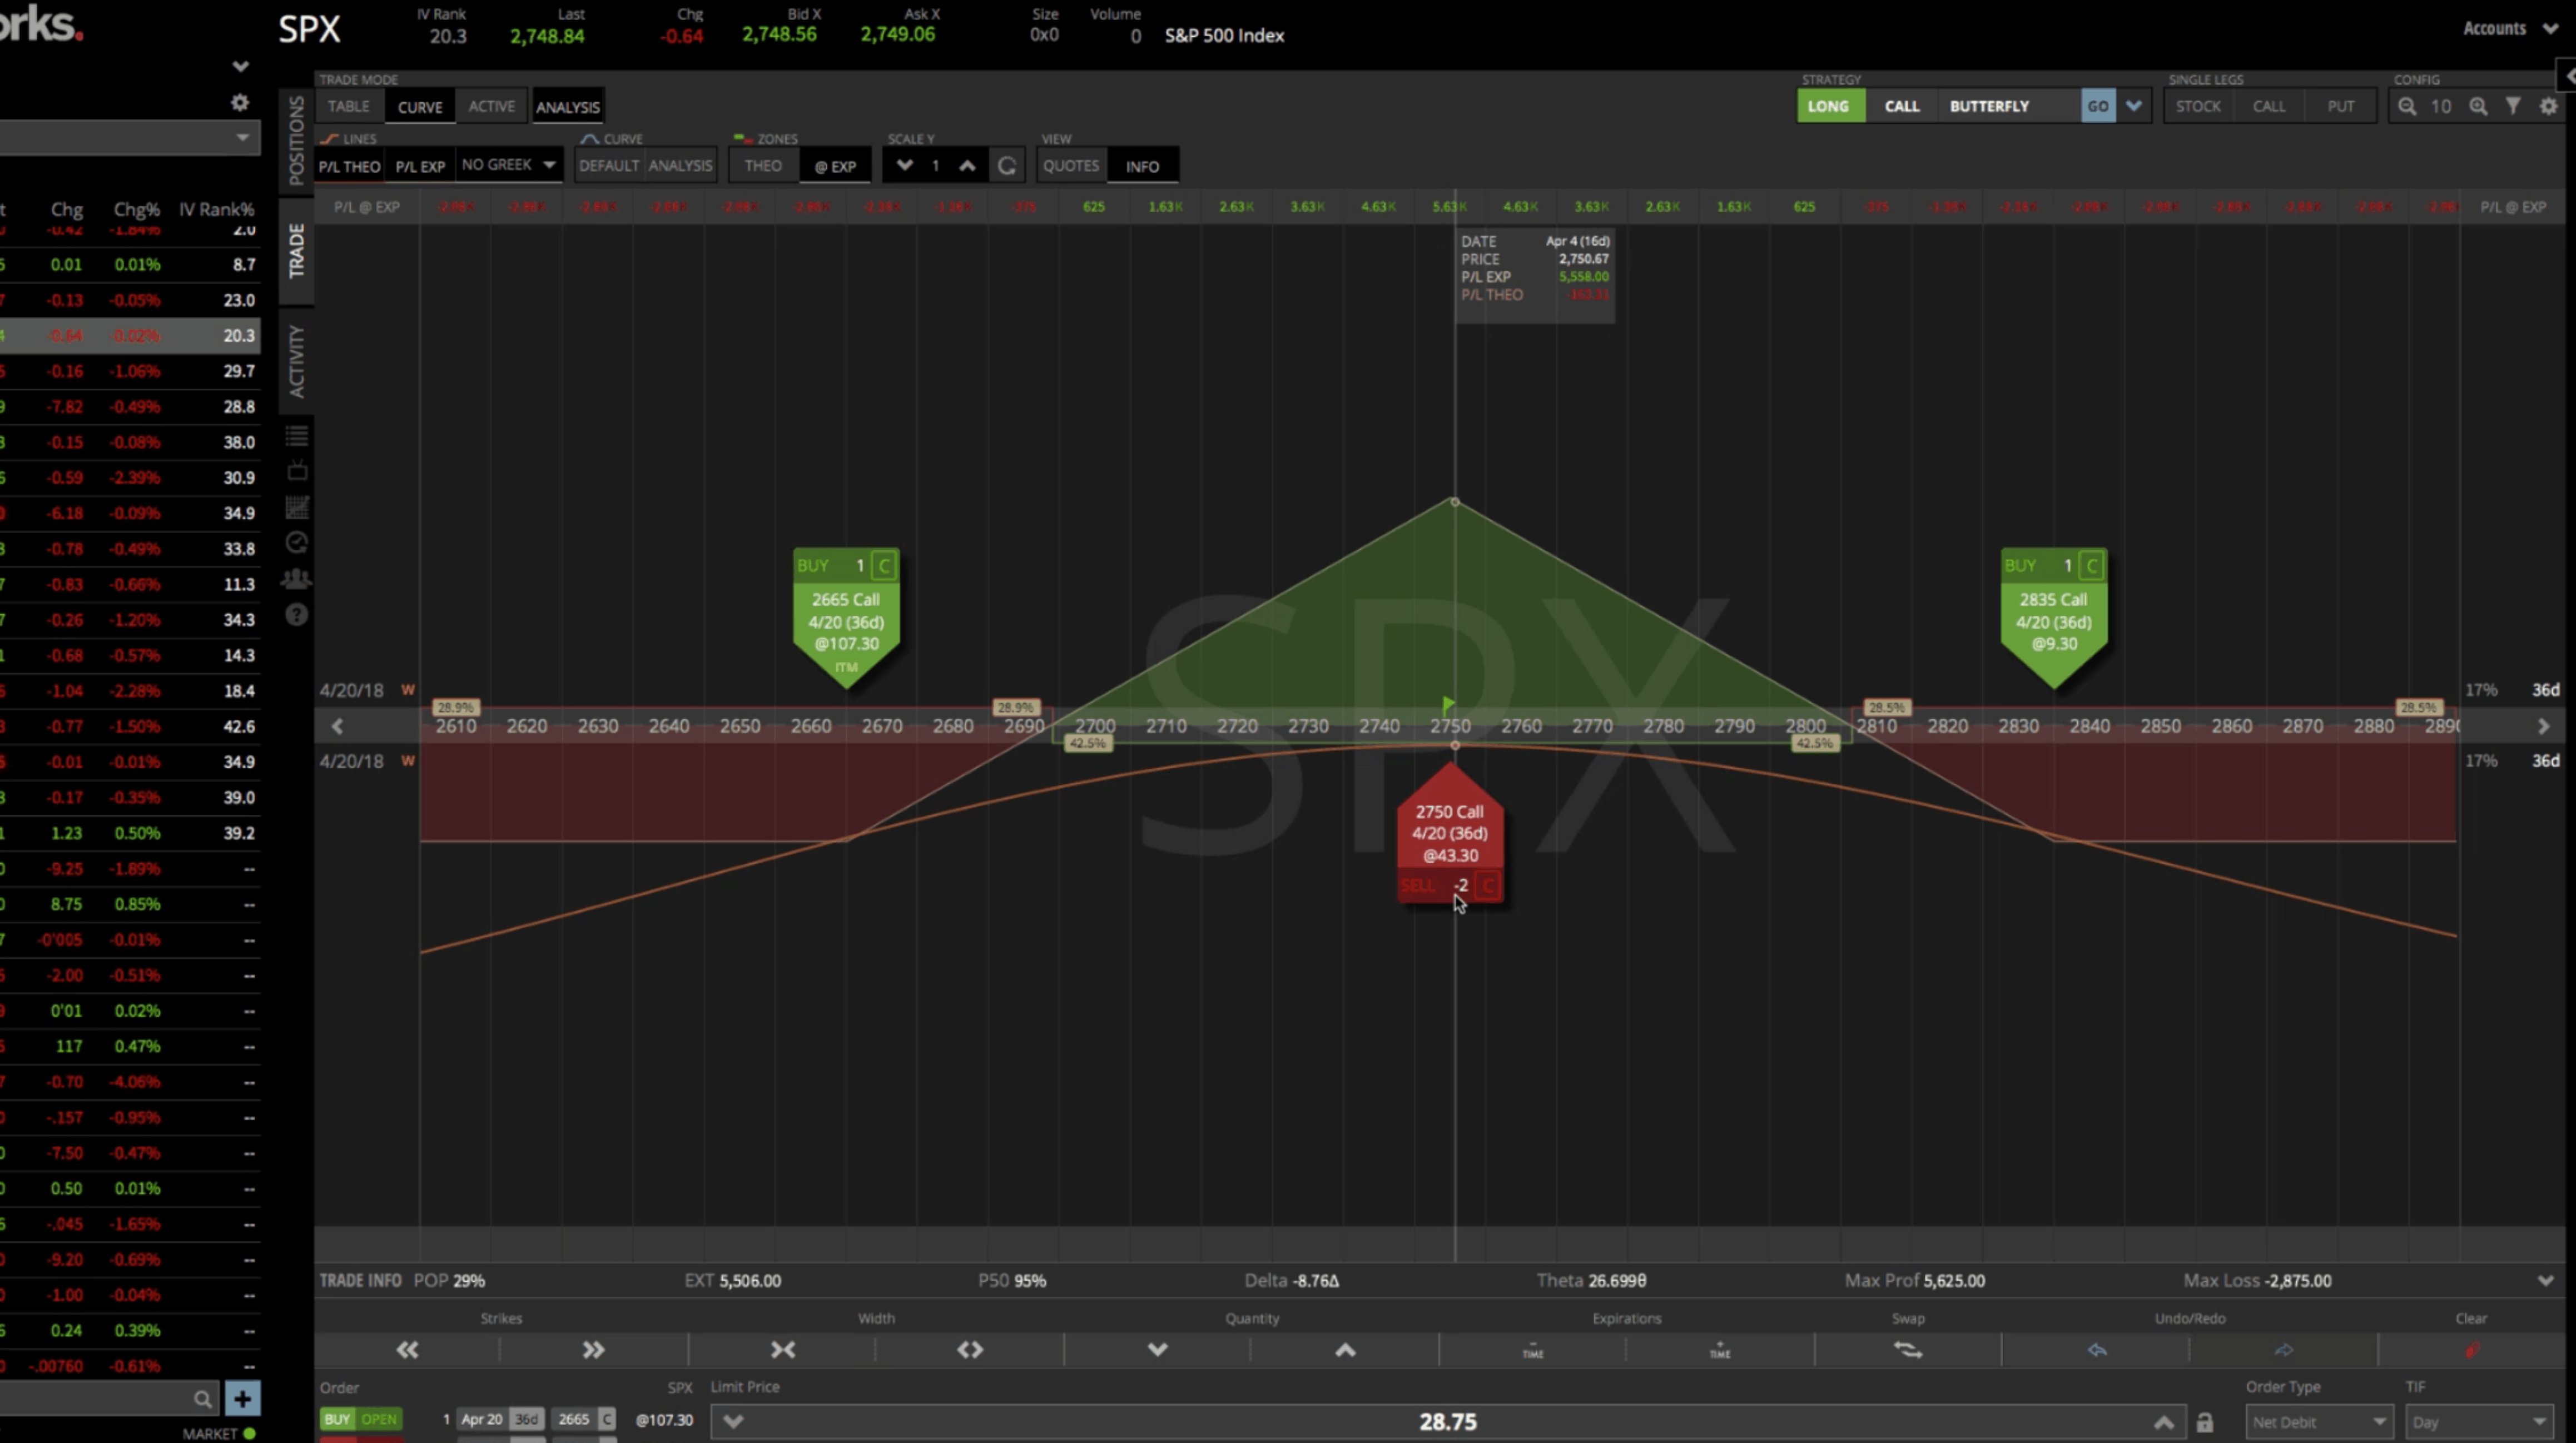

If you look at this and say, “Man I’d like my butterfly to be a little bit wider.” You can just click and drag the green arrow looking tabs on either side, if you like. Or if you want it to be a little bit more narrow you can bring them in to have a little bit more of a narrow butterfly. That gives you an idea of what the Butterfly looks like. You can scroll your mouse and look at the little flag to see what your P&L expiration would be.
The max risk on the down side is $1,565 and on the upside $2,065. This is a little bit unbalanced because we were moving the strikes around. You can see at the very peak your max profit is $4,935. Obviously we’re not going hold all the way to expiration, but that gives you a visual representation of the Butterfly.
You can pop out your window here and change the different expirations, and change the day that we’re look at. As we move through time you can see your P&L line.
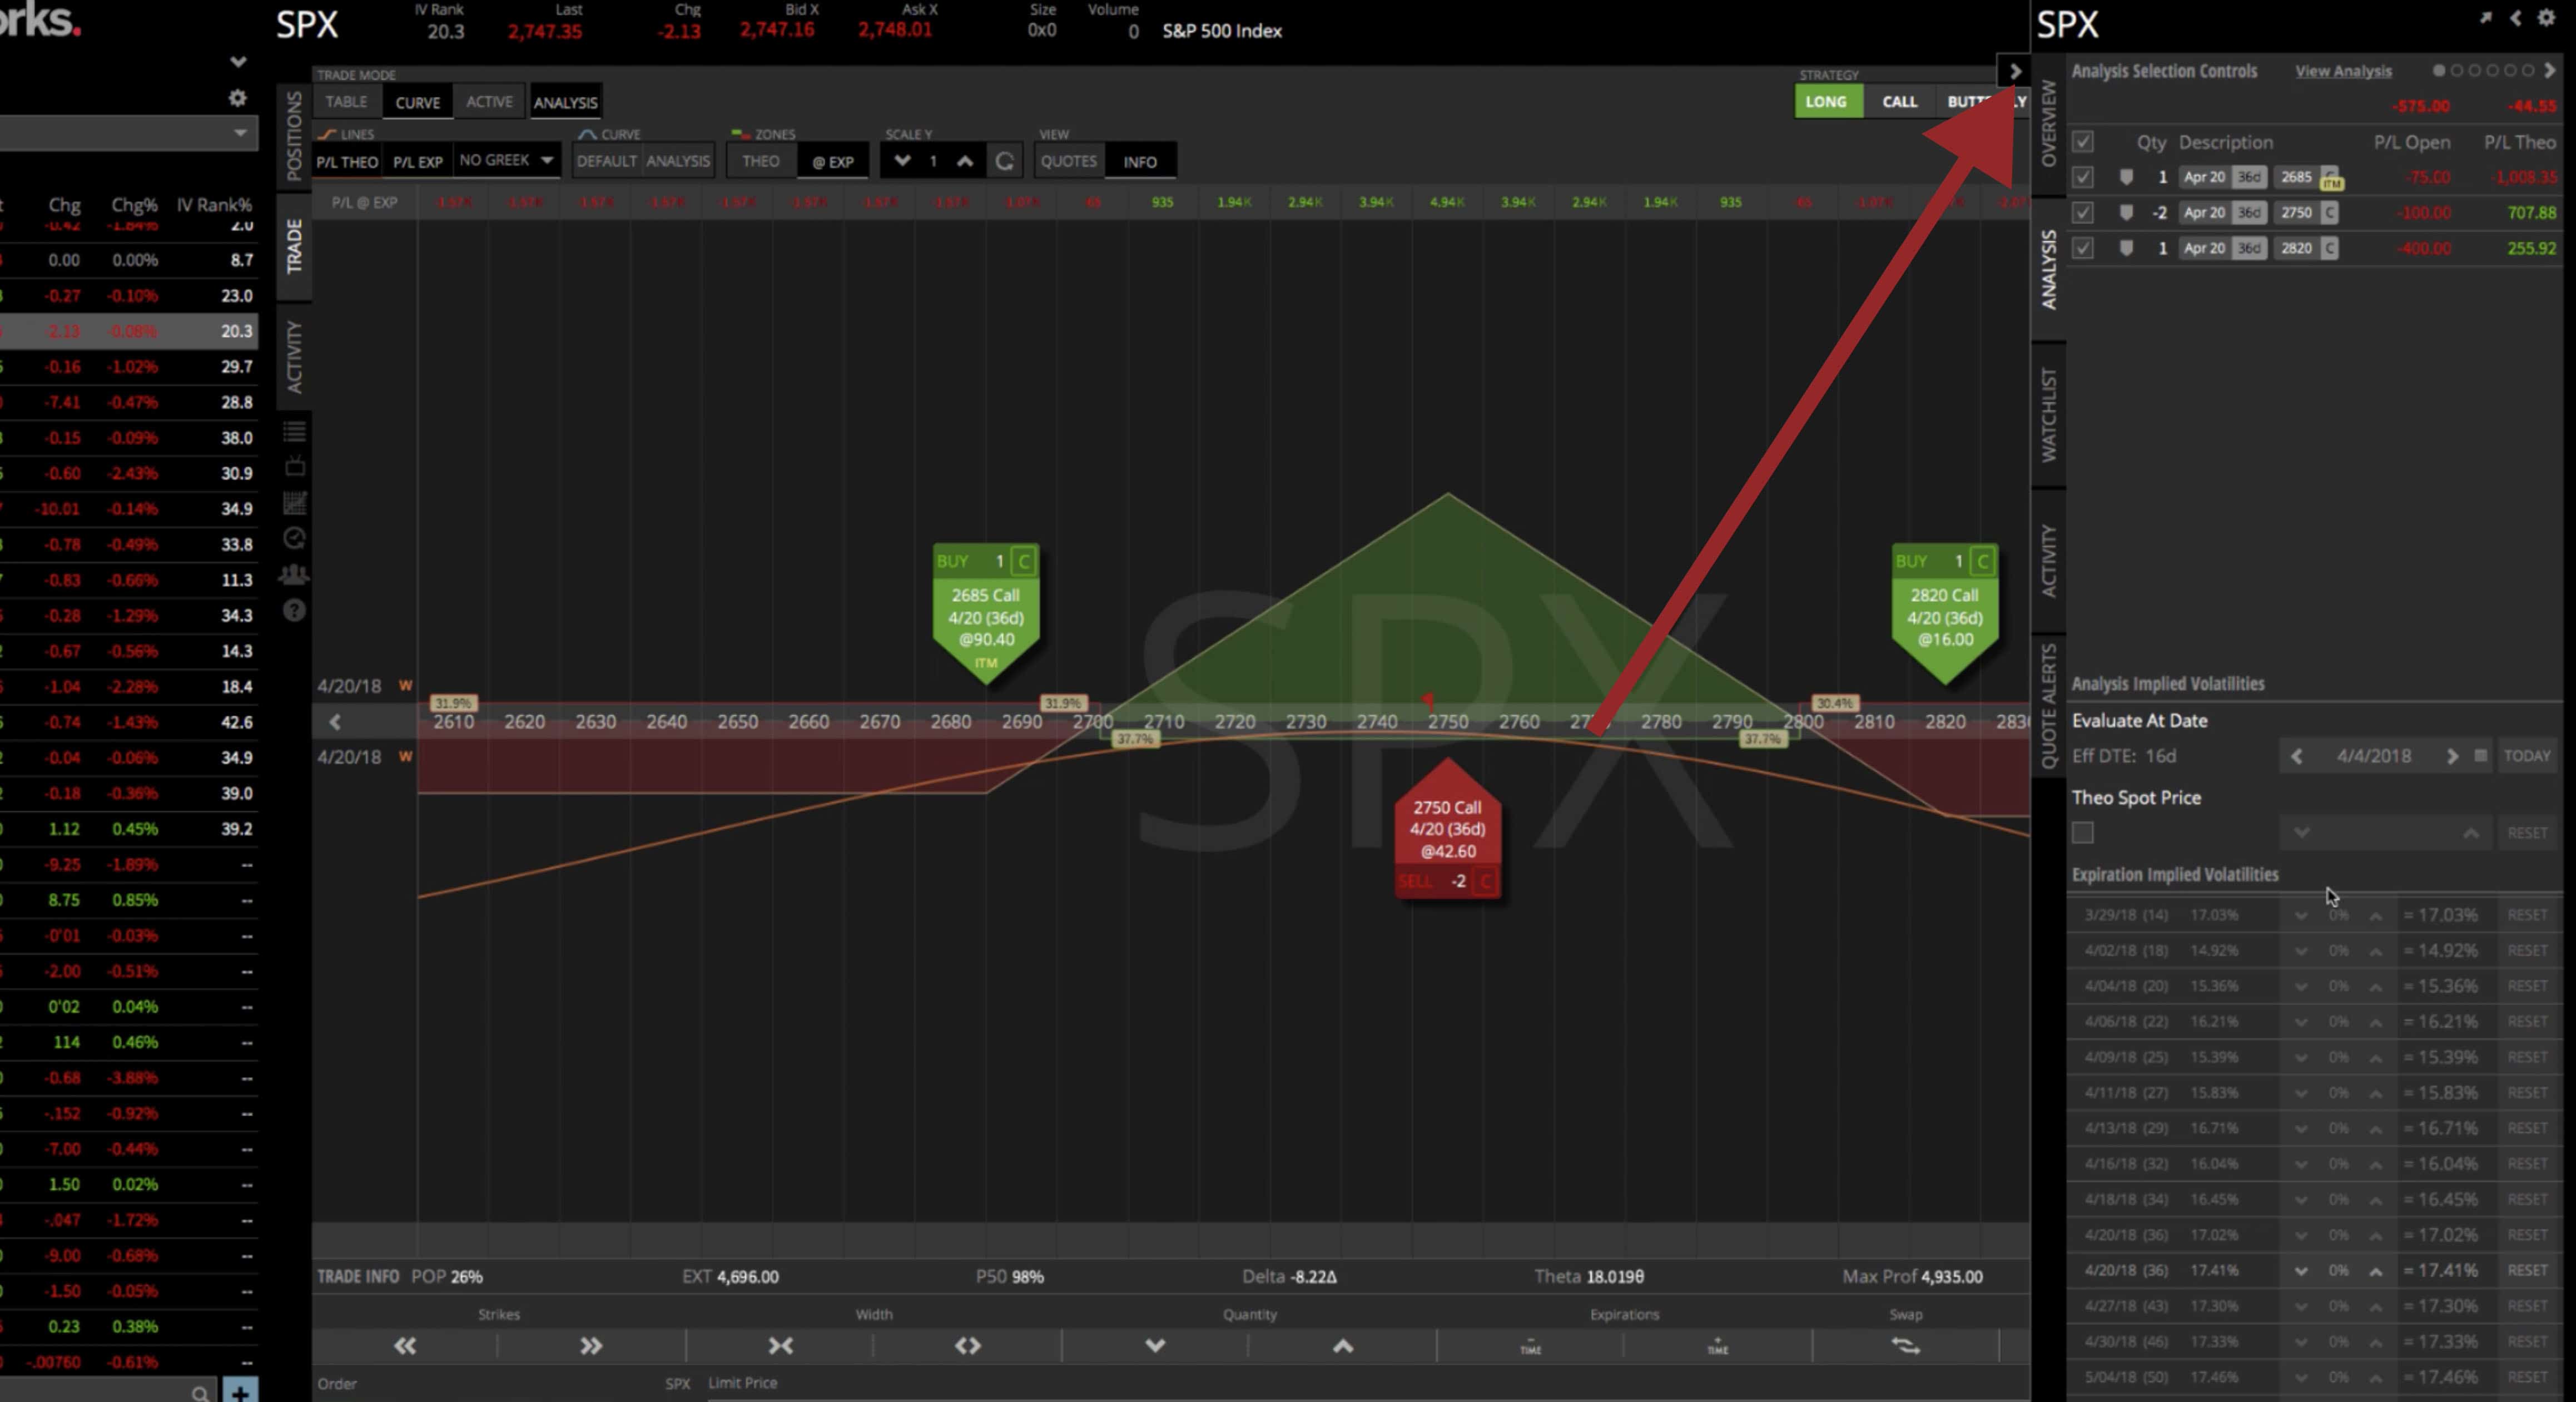

You can play with the volatility. Obviously, we want volatility to contract to benefit this. You can see as volatility goes down, your profit line goes up. You can play with that and get an idea of how the position will perform based on price and volatility and time and all the stuff that goes into trading Butterfly Spreads.
I hope that was helpful in showing you how to set up a Butterfly Spread in Tastyworks!

Follow